Fig. 1.
Download original image
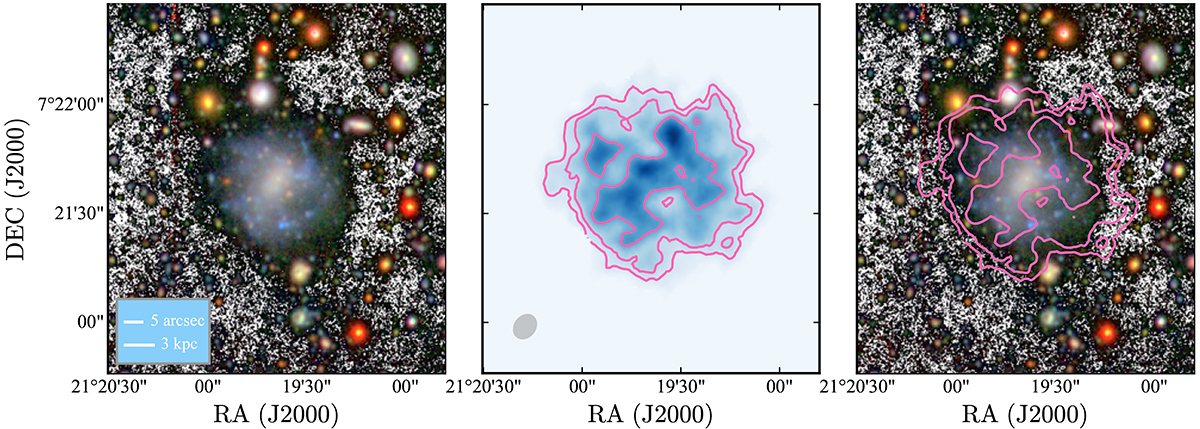
Optical and H I morphologies of AGC 114905. Left: optical colour image of the stellar disc generated using the filters g, r and i. The black and white background was created using the g-band image. For reference, scales of 5 arcsec and 3 kpc (assuming a distance of 78.7 Mpc) are shown. Middle: H I total intensity map with H I column density contours overlaid. The contours are at 1, 2, 4 × 1020 cm−2, and the noise of the H I column density map is 4.1 × 1019 cm−2. The grey ellipse shows the beam of the observations. Right: H I column density map overlaid on the optical emission.
Current usage metrics show cumulative count of Article Views (full-text article views including HTML views, PDF and ePub downloads, according to the available data) and Abstracts Views on Vision4Press platform.
Data correspond to usage on the plateform after 2015. The current usage metrics is available 48-96 hours after online publication and is updated daily on week days.
Initial download of the metrics may take a while.