Fig. 3.
Download original image
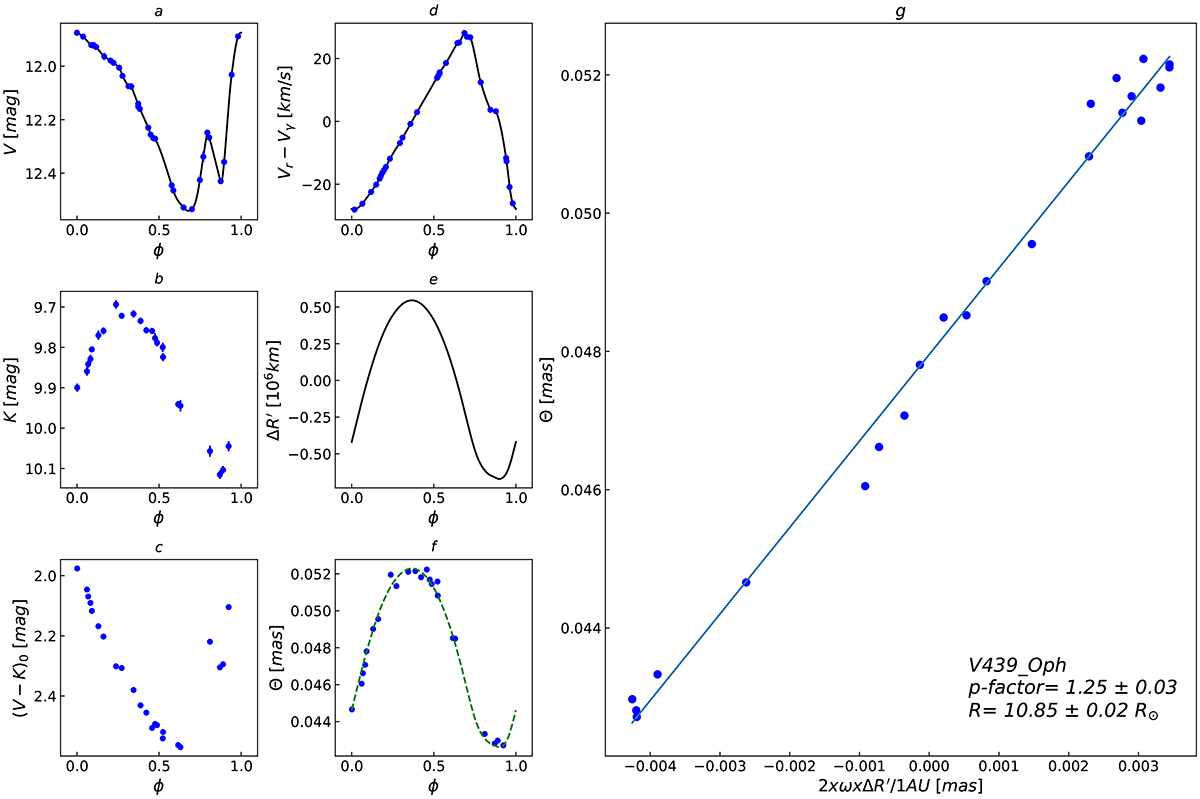
Baade-Wesselink analysis of V439 Oph. Panels a, b, and d show our V, KS, and radial velocity measurements, respectively. Panel c shows the unreddened colour index curve. Black lines in these plots are Akima splines fitted to the measurements. Panel e shows the integrated radial velocity curve. Panel f shows the angular diameter measured using the K04b SBCR. The green line in this panel is the curve from panel e, rescaled using equation 4 and measured values of the p-factor and the mean radius. Panel g shows the relation between angular diameters from panel f and corresponding values of the integrated radial velocity from panel e, rescaled using equation (4). The slope of this relation is the p-factor, and the zero point is the mean angular diameter used to calculate the mean radius of the star.
Current usage metrics show cumulative count of Article Views (full-text article views including HTML views, PDF and ePub downloads, according to the available data) and Abstracts Views on Vision4Press platform.
Data correspond to usage on the plateform after 2015. The current usage metrics is available 48-96 hours after online publication and is updated daily on week days.
Initial download of the metrics may take a while.