Fig. 8
Download original image
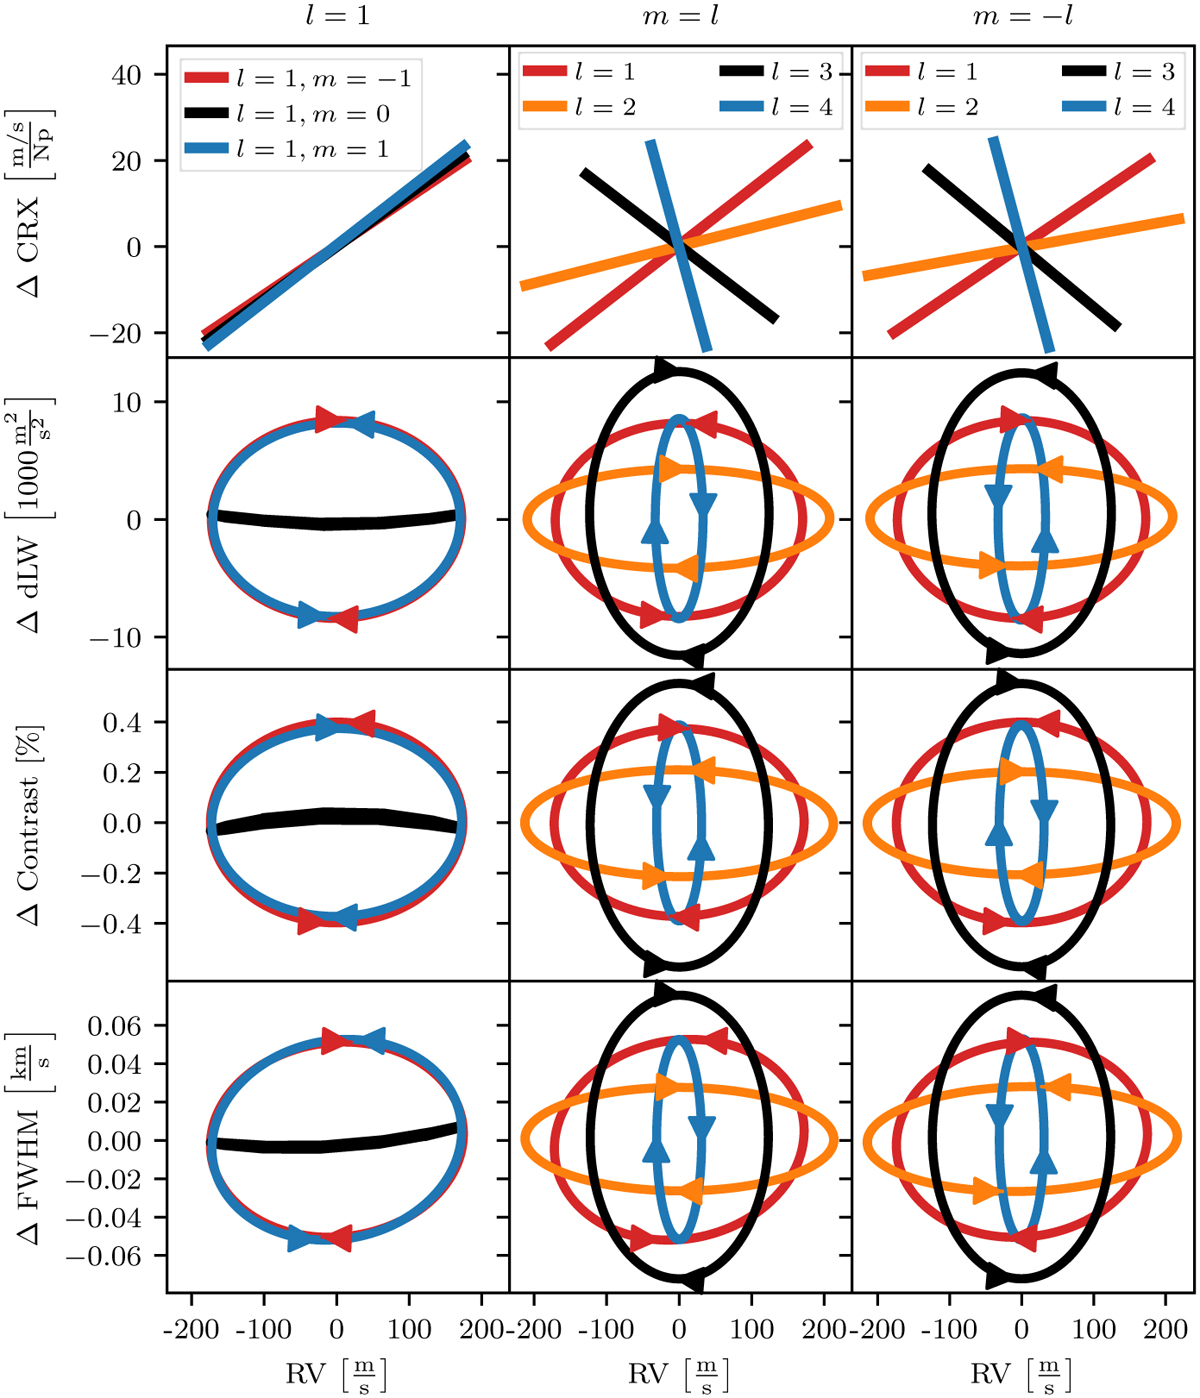
Correlation plots between the activity indicators and the RVs for modes with l = 1 (left column), m = l (center column), and m = −l (right column). Linear correlations were fitted for the correlation between CRX and RV. For the line shape diagnostics, ellipses were fitted when appropriate. Arrows indicate the temporal dependence of the ellipses. The individual modes are specified in the legend at the top of each column. The simulated dLW variations were rescaled with a common factor of 0.1.
Current usage metrics show cumulative count of Article Views (full-text article views including HTML views, PDF and ePub downloads, according to the available data) and Abstracts Views on Vision4Press platform.
Data correspond to usage on the plateform after 2015. The current usage metrics is available 48-96 hours after online publication and is updated daily on week days.
Initial download of the metrics may take a while.