Fig. 7
Download original image
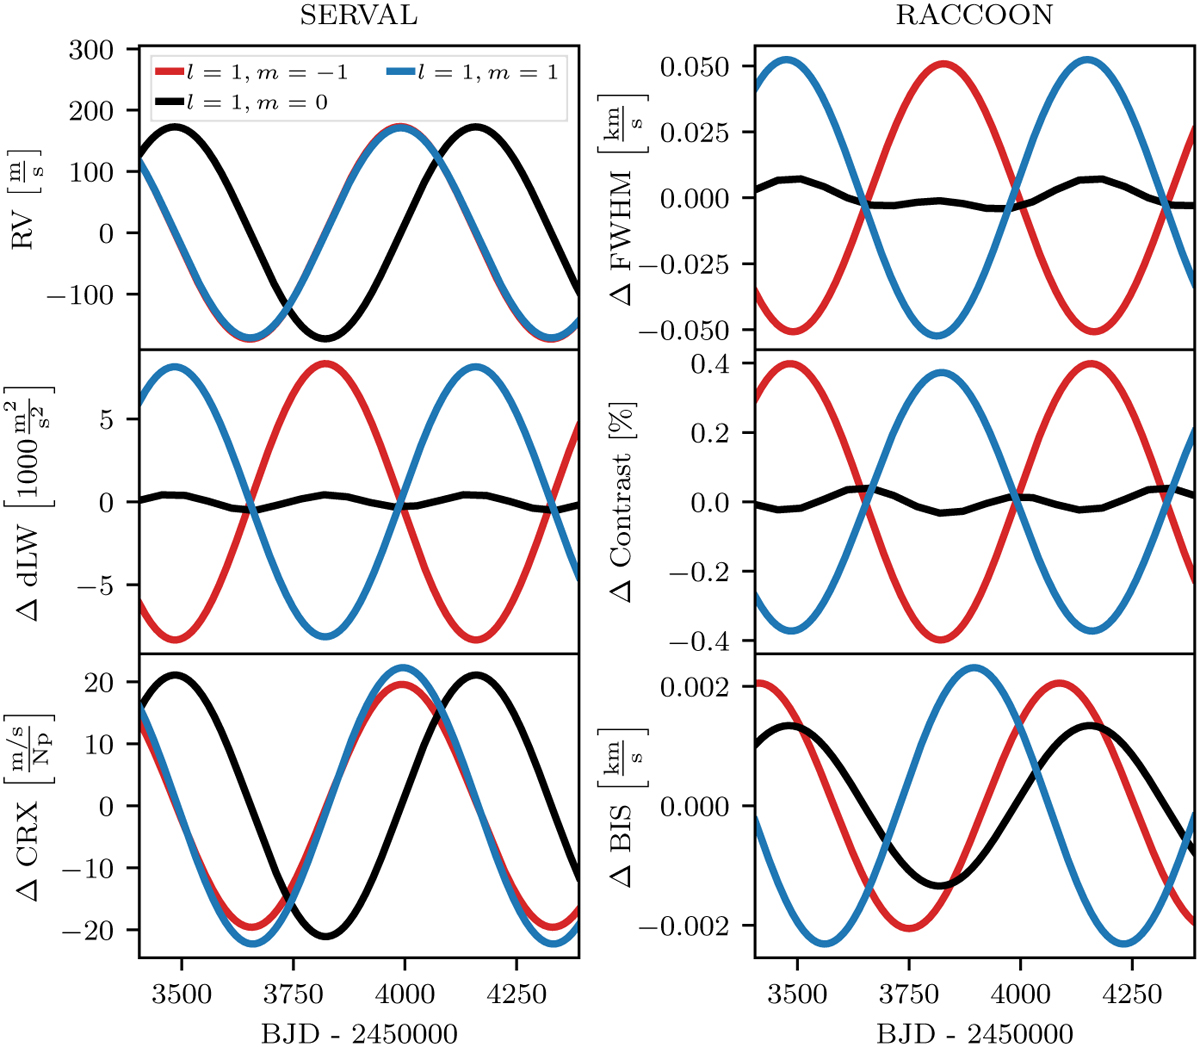
RVs and activity indicators of dipole oscillation modes plotted against time at inclination angle i = 45°. Sinusoids were fitted to all time series except for the FWHM, dLW, and contrast in case of m = 0, for which the simulated points were interconnected. While all three modes cause similar RV variations (top left panel), the phase relations between the RVs and the line shape indicators, as well as their amplitudes, are notably different. The CRX (bottom left) shows a similar behavior for all three modes. The dLW variations were rescaled with a common factor of 0.1.
Current usage metrics show cumulative count of Article Views (full-text article views including HTML views, PDF and ePub downloads, according to the available data) and Abstracts Views on Vision4Press platform.
Data correspond to usage on the plateform after 2015. The current usage metrics is available 48-96 hours after online publication and is updated daily on week days.
Initial download of the metrics may take a while.