Fig. 5
Download original image
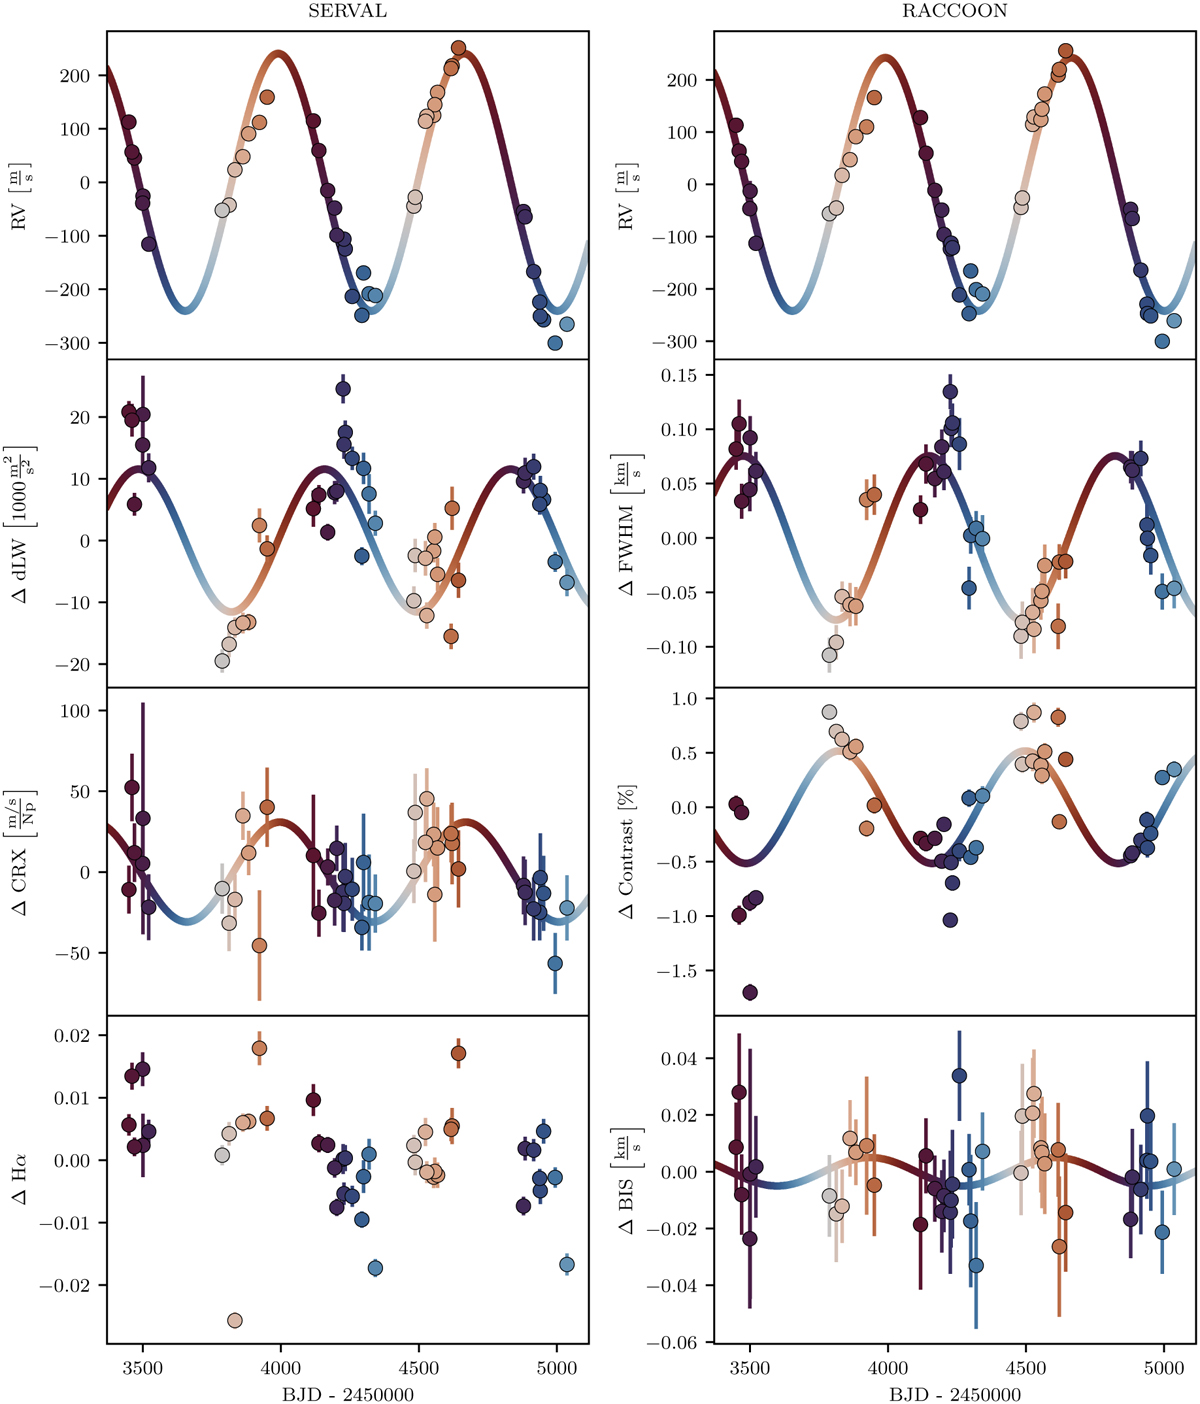
Observed (data points) and simulated (lines) RVs and activity indicators of the 44 HARPS spectra acquired prior to 2015 plotted against time. The same color-coding as in Fig. 4 was applied. The mean RV was subtracted from both the SERVAL and RACCOON RV time series, as well as the mean of each indicator time series The color-coded solid lines are sinusoidal fits to the simulated spectra computed for the best l = 1, m = 1 mode. The simulation is able to reproduce the amplitudes and phases of all indicators, although some (real) indicators suffer from large scatter. As the simulations focus solely on the stellar photosphere, no meaningful variation of the Hα indicator can be simulated.
Current usage metrics show cumulative count of Article Views (full-text article views including HTML views, PDF and ePub downloads, according to the available data) and Abstracts Views on Vision4Press platform.
Data correspond to usage on the plateform after 2015. The current usage metrics is available 48-96 hours after online publication and is updated daily on week days.
Initial download of the metrics may take a while.