Fig. 4
Download original image
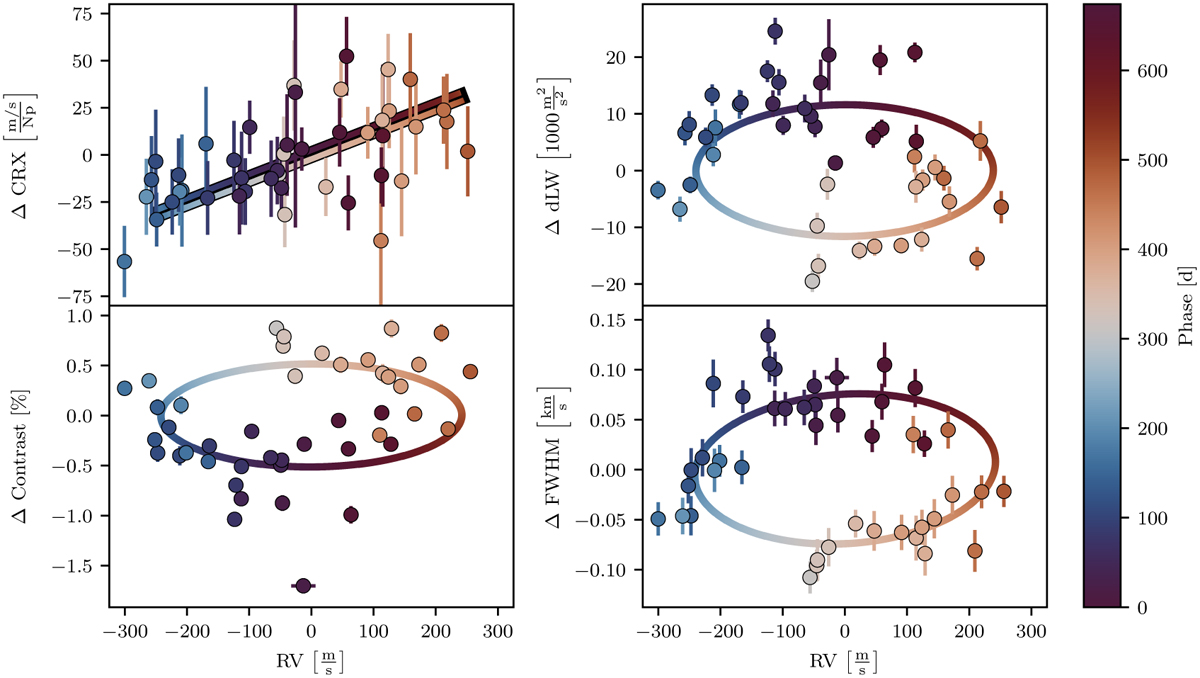
Observed (data points) and simulated (lines) correlations between the activity indicators and the RVs for 44 spectra taken prior to the HARPS fiber change. For each panel, the mean (RV and any of the indicators, respectively) was subtracted. Each data point is color-coded with the phase according to the best RV period P = 674.0 d. While the CRX (top left) shows a significant positive correlation with the RVs (r = 0.54, p(F-test) = 0.002%), dLW, FWHM, and contrast of the CCF are correlated with the RVs in a closed-loop behavior. We plot the linear (CRX) and elliptical fits (dLW, FWHM, contrast) to the simulated data points for the best model of a l = 1, m = 1 oscillation mode as solid lines applying the same color-coding. As a linear relationship is predicted between CRX and RV, we plot the ascending and descending phase relations on top of the black fit to the simulations. The simulated ellipses can closely reproduce the observed behavior including the amplitudes, phases, and directions of correlation.
Current usage metrics show cumulative count of Article Views (full-text article views including HTML views, PDF and ePub downloads, according to the available data) and Abstracts Views on Vision4Press platform.
Data correspond to usage on the plateform after 2015. The current usage metrics is available 48-96 hours after online publication and is updated daily on week days.
Initial download of the metrics may take a while.