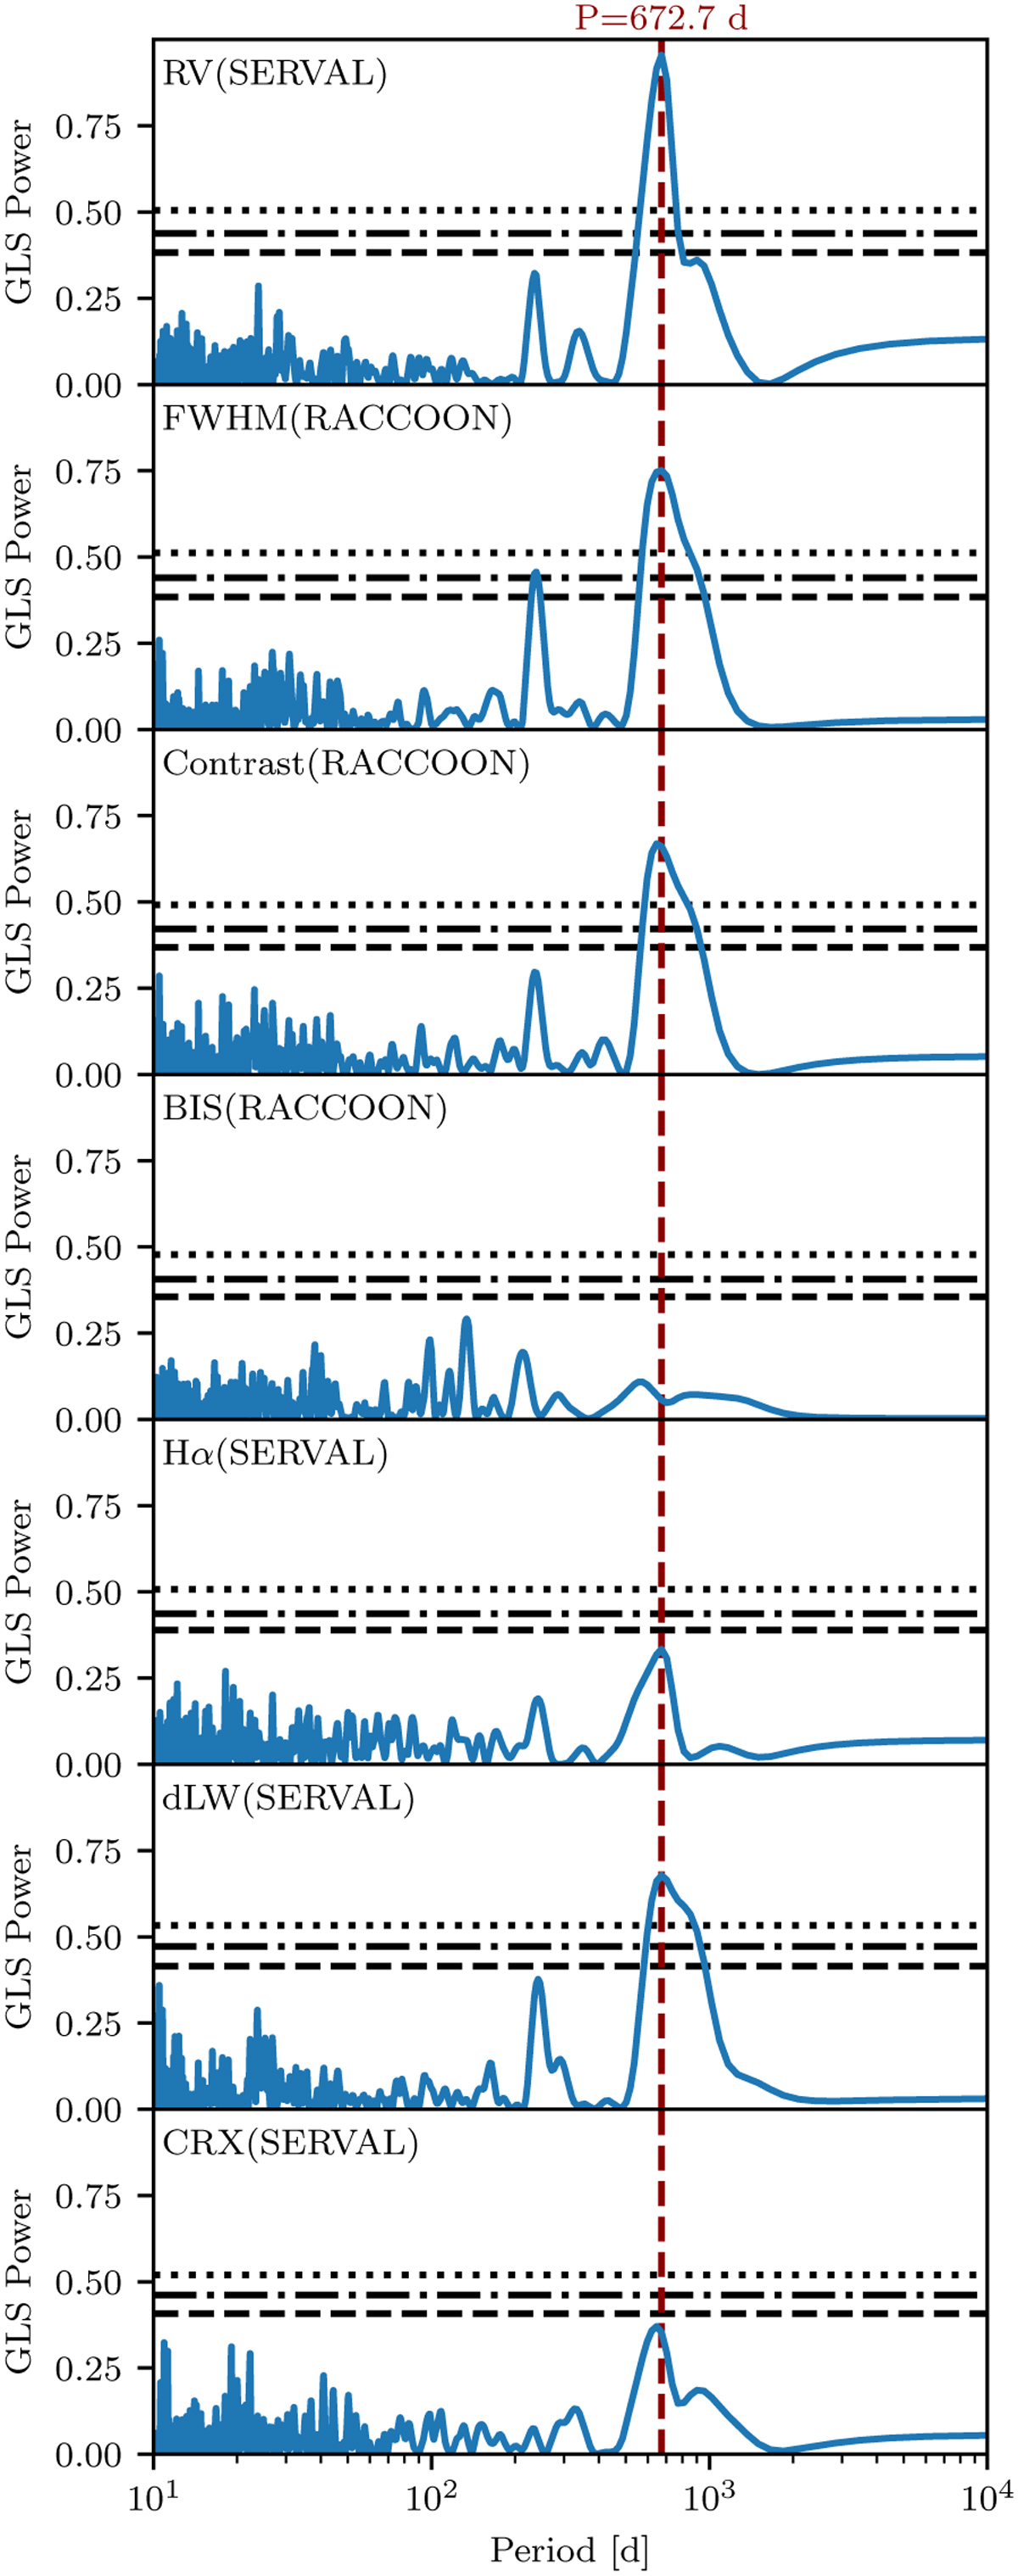
Fig. 3
Download original image
GLS periodograms of the RVs and activity indicators calculated for the 44 HARPS spectra acquired prior to the fiber change. The FAP of 5% (dashed line), 1% (dash-dotted line), and 0.1% (dotted line) were determined using a bootstrap with 10 000 reshuffles and are plotted for each panel. The strong RV periodicity at P = 672.7 d is accompanied by significant periodicity of the FWHM and contrast of the CCF and the dLW. The Hα indicator of the SERVAL reduction and the CRX show peaks at or very close to the orbital period that, however, have FAP > 5%. The BIS is inconspicuous.
Current usage metrics show cumulative count of Article Views (full-text article views including HTML views, PDF and ePub downloads, according to the available data) and Abstracts Views on Vision4Press platform.
Data correspond to usage on the plateform after 2015. The current usage metrics is available 48-96 hours after online publication and is updated daily on week days.
Initial download of the metrics may take a while.