Fig. 2
Download original image
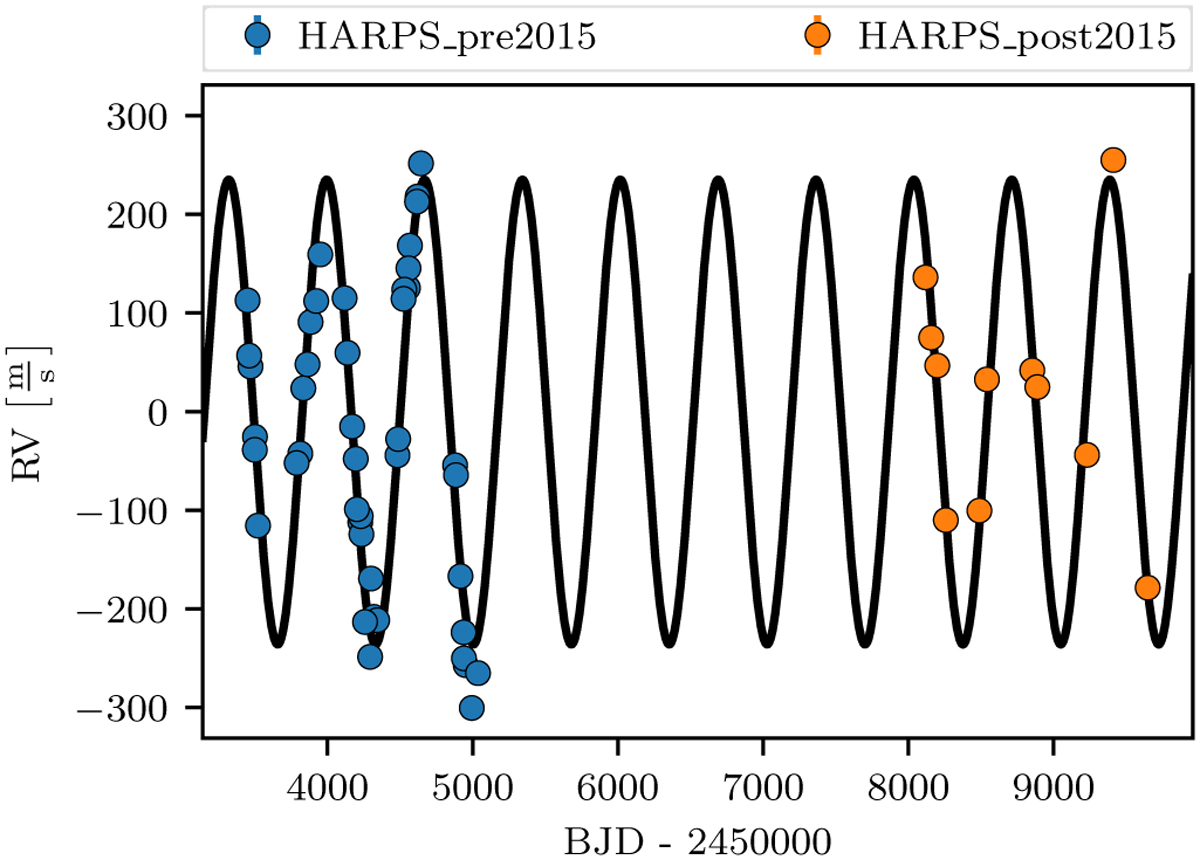
RVs reduced by SERVAL prior to (blue) and after (orange) the HARPS fiber change in 2015 plotted against time. The error bars are smaller than the size of the markers. A sinusoidal fit is plotted in black and reveals the RVs to be consistent with a long-lived, coherent signal that could (when examined in isolation to other diagnostics) be attributed to a brown dwarf orbiting the primary.
Current usage metrics show cumulative count of Article Views (full-text article views including HTML views, PDF and ePub downloads, according to the available data) and Abstracts Views on Vision4Press platform.
Data correspond to usage on the plateform after 2015. The current usage metrics is available 48-96 hours after online publication and is updated daily on week days.
Initial download of the metrics may take a while.