Fig. B.2
Download original image
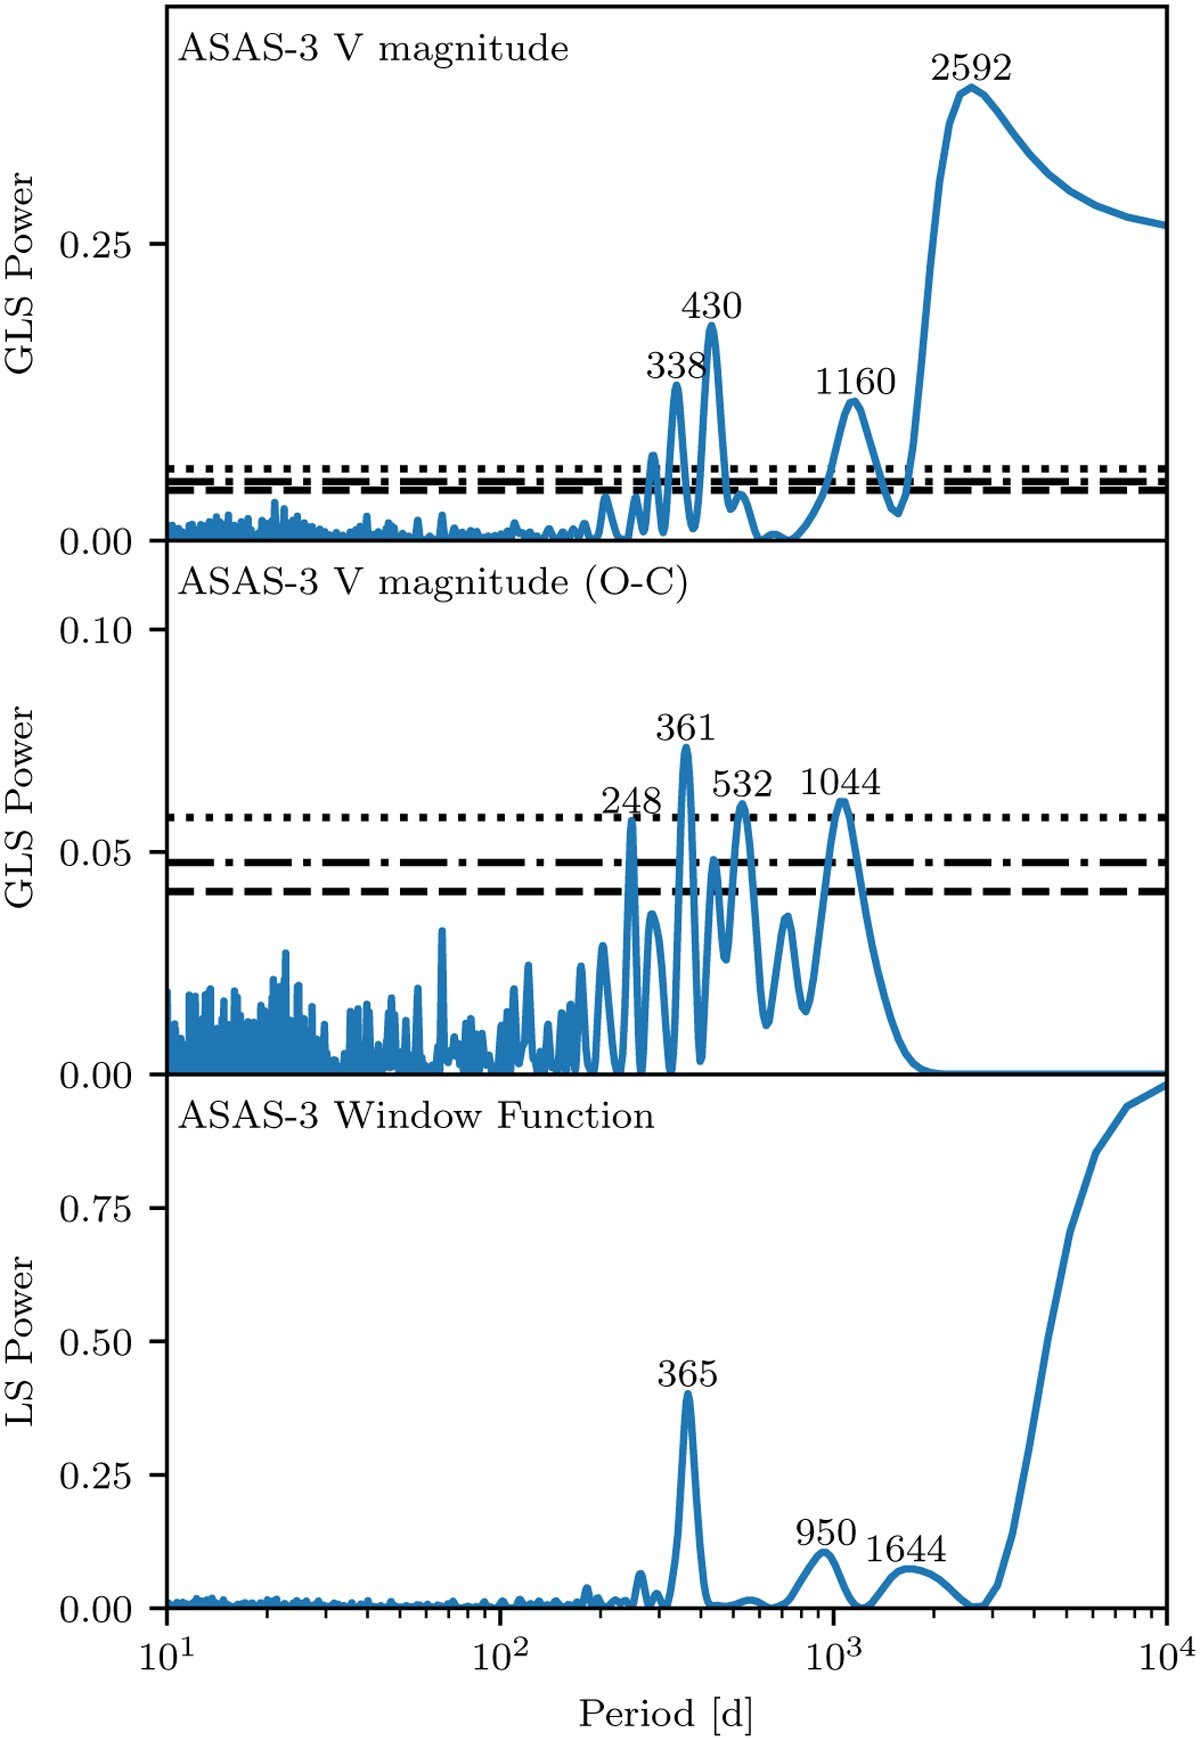
GLS periodogram analysis of the ASAS-3 V-band photometry. Top: GLS periodogram of the original photometry. The FAP levels of 5% (dashed), 1% (dash-dotted), and 0.1% (dotted) were computed via bootstrapping with 10 000 reshuffles and are plotted as horizontal lines. The periods of the four most prominent peaks are given in units of days. Middle: GLS periodogram of the residual photometry after removing the 2571 d fit. Bottom: LS periodogram of the window function.
Current usage metrics show cumulative count of Article Views (full-text article views including HTML views, PDF and ePub downloads, according to the available data) and Abstracts Views on Vision4Press platform.
Data correspond to usage on the plateform after 2015. The current usage metrics is available 48-96 hours after online publication and is updated daily on week days.
Initial download of the metrics may take a while.