Fig. A.1
Download original image
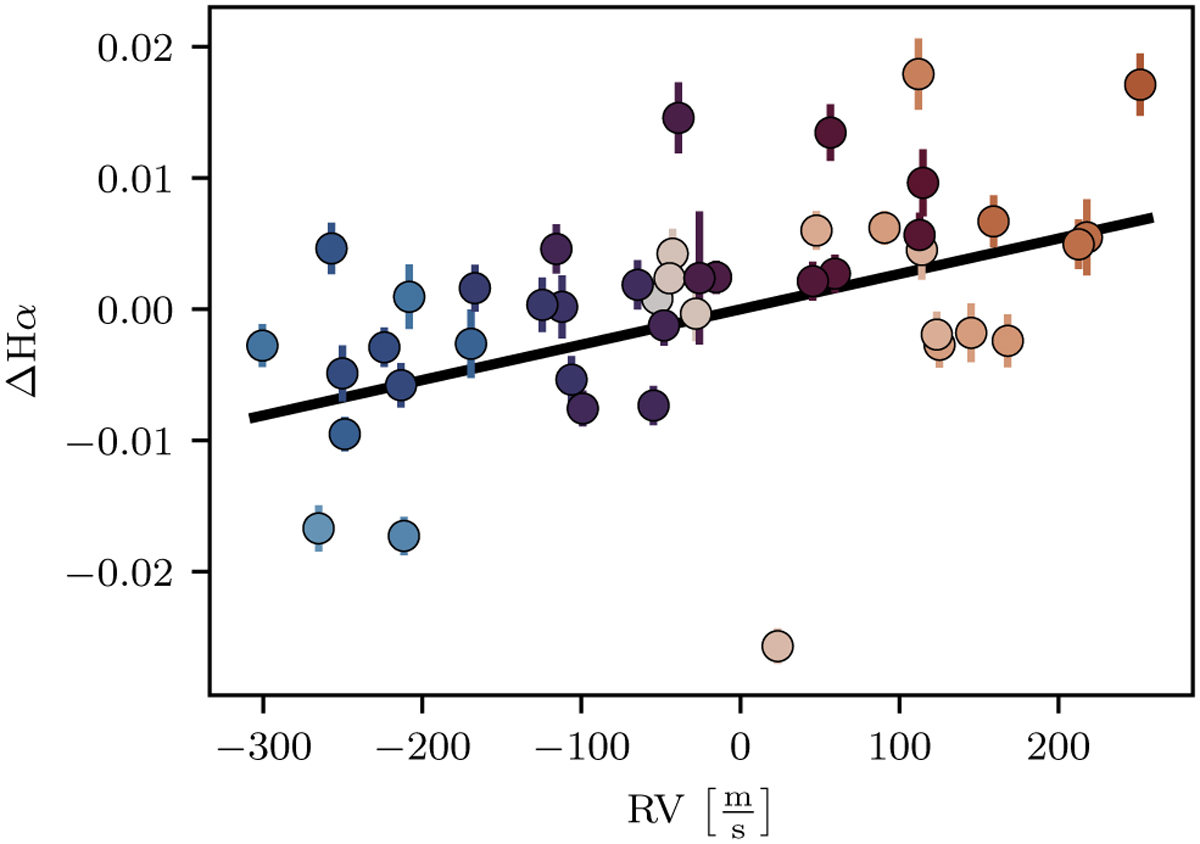
Correlation between Hα indicator (absolute difference from the mean) and RV for the 44 spectra acquired prior to the HARPS fiber change. The same color-coding as in Fig. 4 applies. A linear relation (black line) was fitted to the data. An F-test against a constant model confirms the correlation to be significant with a p-value p(F-test) = 0.2% and Pearson’s r coefficient r = 0.48.
Current usage metrics show cumulative count of Article Views (full-text article views including HTML views, PDF and ePub downloads, according to the available data) and Abstracts Views on Vision4Press platform.
Data correspond to usage on the plateform after 2015. The current usage metrics is available 48-96 hours after online publication and is updated daily on week days.
Initial download of the metrics may take a while.