Fig. 5.
Download original image
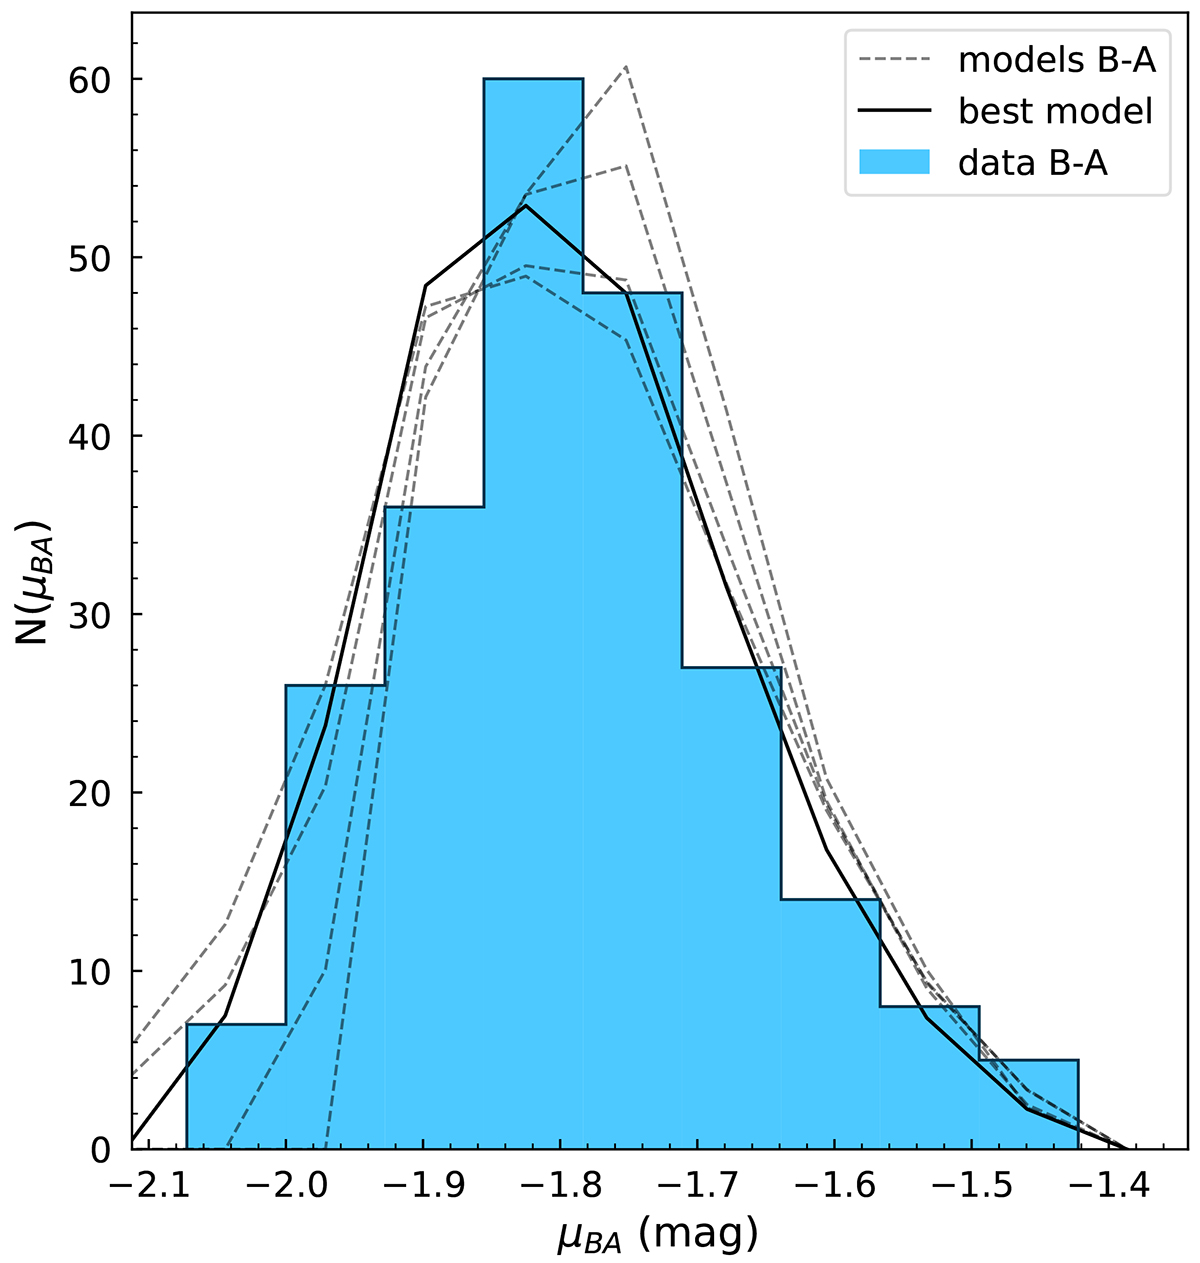
Microlensing frequency distributions derived from the observed light curves (illustrated with a blue-colored histogram) compared to those obtained from simulated microlensing magnification maps (depicted by gray and black lines). The polygonal lines represent model histograms for various values of R1/2 ranging from 2.0 to 3.0 light-days. The thick line highlights the model’s best fit to the observed data, with R1/2 = 2.2 ± 0.3 light-days. We note that the observational histogram was shifted by −0.07 mag to achieve the best alignment with the model histograms.
Current usage metrics show cumulative count of Article Views (full-text article views including HTML views, PDF and ePub downloads, according to the available data) and Abstracts Views on Vision4Press platform.
Data correspond to usage on the plateform after 2015. The current usage metrics is available 48-96 hours after online publication and is updated daily on week days.
Initial download of the metrics may take a while.