Fig. 4.
Download original image
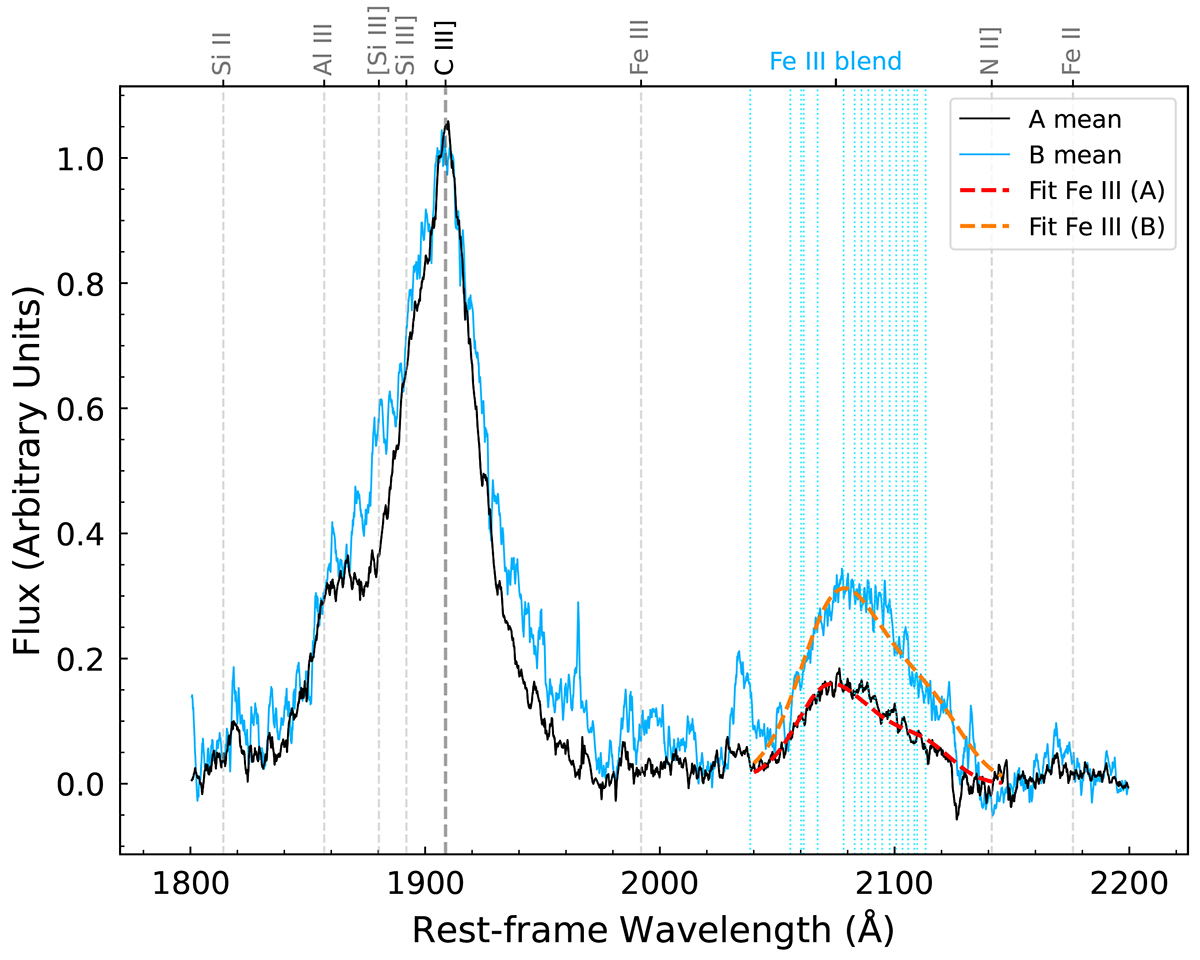
Average spectra for images A (in black) and B (in blue), focusing on the regions around the C III] emission line and the Fe III λλ2039−2113 emission feature. The continuum has been subtracted, and the spectra normalized to the core of the C III] line. Vertical dotted blue lines mark the wavelengths of the Fe III lines as per the Vestergaard & Wilkes (2001) template. Dashed red and orange curves represent fits to the Fe III λλ2039−2113 blend in images A and B, respectively, shifted by approximately ∼8 Å and ∼12 Å to match the template rest-frame. The ordinate is in arbitrary flux units.
Current usage metrics show cumulative count of Article Views (full-text article views including HTML views, PDF and ePub downloads, according to the available data) and Abstracts Views on Vision4Press platform.
Data correspond to usage on the plateform after 2015. The current usage metrics is available 48-96 hours after online publication and is updated daily on week days.
Initial download of the metrics may take a while.