Fig. 3.
Download original image
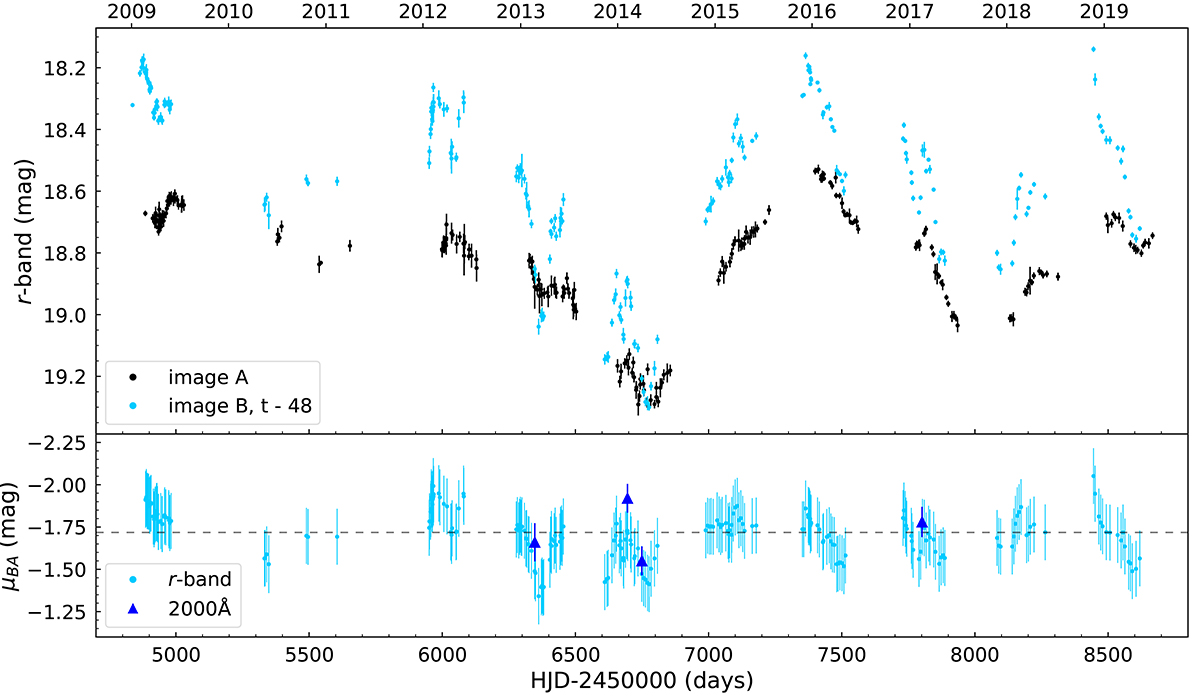
Light curves and differential microlensing variability of the quasar SDSS J1339+1310. Upper panel: Light curves of the lensed images A (black) and B (light blue), as obtained by the GLENDAMA project (refer to Gil-Merino et al. 2018). The light curve of image B is shifted by its time delay (−48 days) relative to image A. Lower panel: Differential microlensing variability in light curve B, compared against a polynomial fit to light curve A. The differential microlensing variability has been corrected for the magnitude difference between the images, using the Mg II line core flux ratio as a baseline for no microlensing. The differential microlensing measurements in the continuum at rest-frame 2000 Å, chosen for its close wavelength proximity to the r-band at 1930 Å, are depicted as blue triangles for comparison. We note that one of the five available spectroscopic epochs has been discarded due to excessive noise in the data. The horizontal axes display Julian (bottom) and Gregorian (top) dates.
Current usage metrics show cumulative count of Article Views (full-text article views including HTML views, PDF and ePub downloads, according to the available data) and Abstracts Views on Vision4Press platform.
Data correspond to usage on the plateform after 2015. The current usage metrics is available 48-96 hours after online publication and is updated daily on week days.
Initial download of the metrics may take a while.