Fig. 2.
Download original image
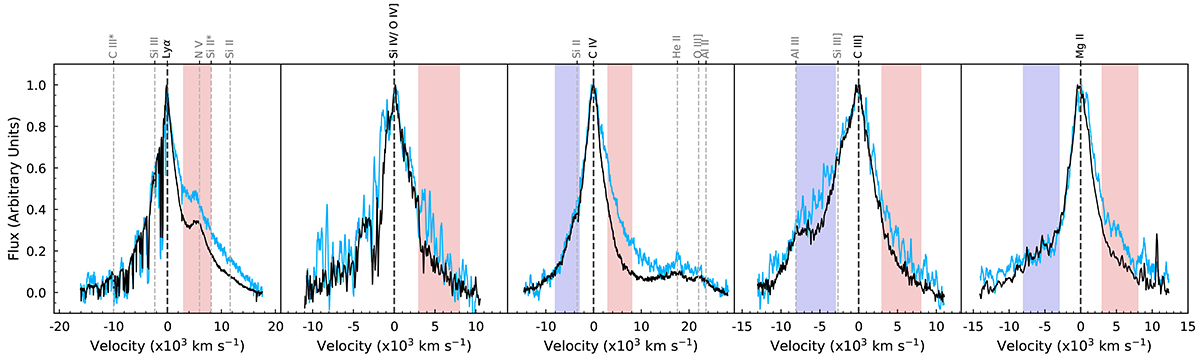
Average Lyα, Si IV, C IV, C III], and Mg II emission line profiles (from left to right) of the images A (black) and B (blue). Blue and red shaded regions indicate the selected windows for magnitude difference calculations, spanning 3000 − 8000 km s−1. We note that the blue wings of Lyα and Si IV are affected by absorption features and have been excluded from our analysis. The observations reveal significant microlensing-induced differences between the images in the red wings of all emission lines. The x-axis is represented on a velocity scale.
Current usage metrics show cumulative count of Article Views (full-text article views including HTML views, PDF and ePub downloads, according to the available data) and Abstracts Views on Vision4Press platform.
Data correspond to usage on the plateform after 2015. The current usage metrics is available 48-96 hours after online publication and is updated daily on week days.
Initial download of the metrics may take a while.