Fig. B.1
Download original image
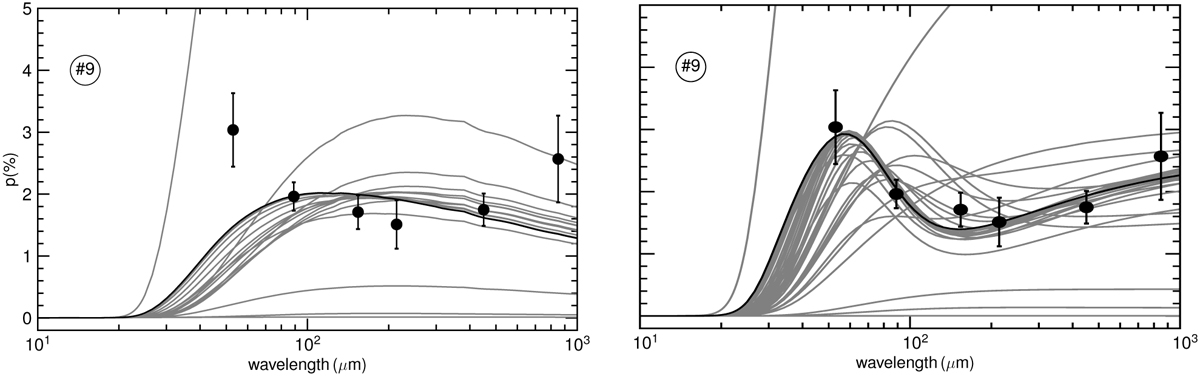
Example of the conversion of the LEAST-SQUARE fitting procedure. The points are the data observed in #9 as in Fig. 3. The solid gray lines are the modelling predictions with parameter variations. The solid black line represents the best fit of the data. The fitting of the one-phase model is in the left panel, while the two-phase model is in the right panel.
Current usage metrics show cumulative count of Article Views (full-text article views including HTML views, PDF and ePub downloads, according to the available data) and Abstracts Views on Vision4Press platform.
Data correspond to usage on the plateform after 2015. The current usage metrics is available 48-96 hours after online publication and is updated daily on week days.
Initial download of the metrics may take a while.