Fig. 3
Download original image
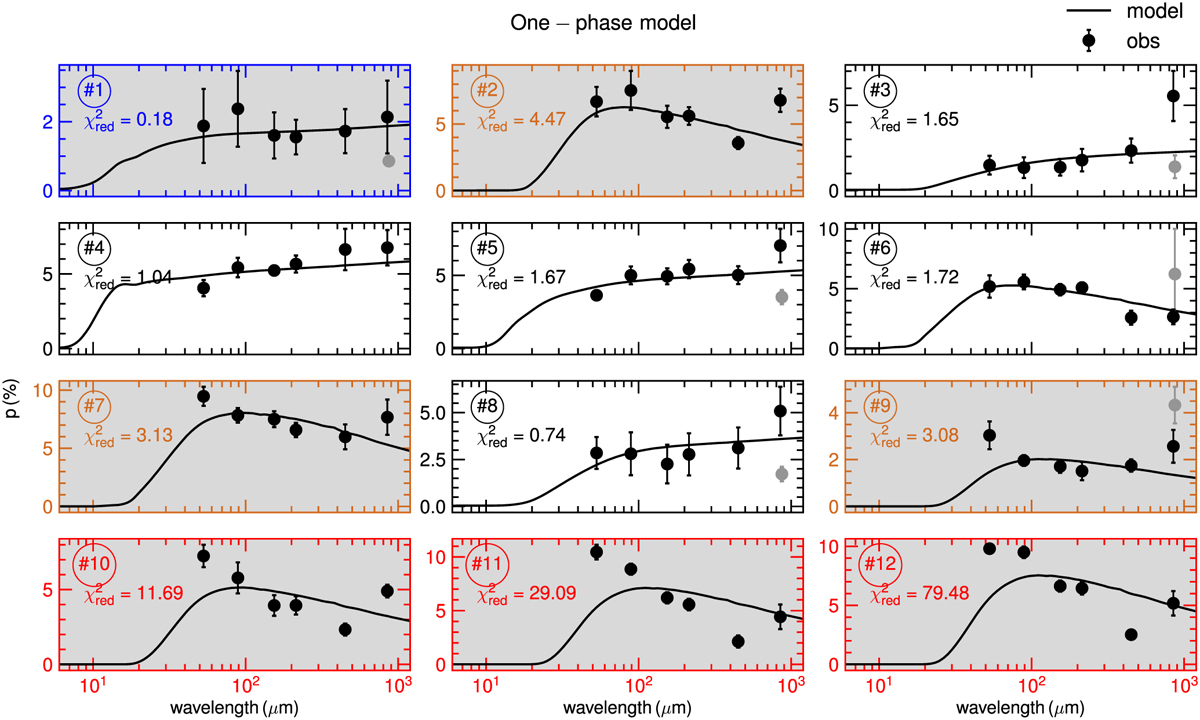
Polarisation spectrum observed by SOFIA/HAWC+ and JCMT/POL-2 (black dots) at 12 different locations in OMC-1 as shown in Fig. 2 with the best one-phase model. The reduced chi-square ![]() indicates the ‘good goodness’ of the fit. The standard χ2 is shown in Table 1. For comparison, we show the APEX/PolKA observations at 870 µm as a gray dot, but exclude them from the fitting. For visual guidance, we colour the frame blue for
indicates the ‘good goodness’ of the fit. The standard χ2 is shown in Table 1. For comparison, we show the APEX/PolKA observations at 870 µm as a gray dot, but exclude them from the fitting. For visual guidance, we colour the frame blue for ![]() , brown for
, brown for ![]() , and red for
, and red for ![]() .
.
Current usage metrics show cumulative count of Article Views (full-text article views including HTML views, PDF and ePub downloads, according to the available data) and Abstracts Views on Vision4Press platform.
Data correspond to usage on the plateform after 2015. The current usage metrics is available 48-96 hours after online publication and is updated daily on week days.
Initial download of the metrics may take a while.