Fig. 2
Download original image
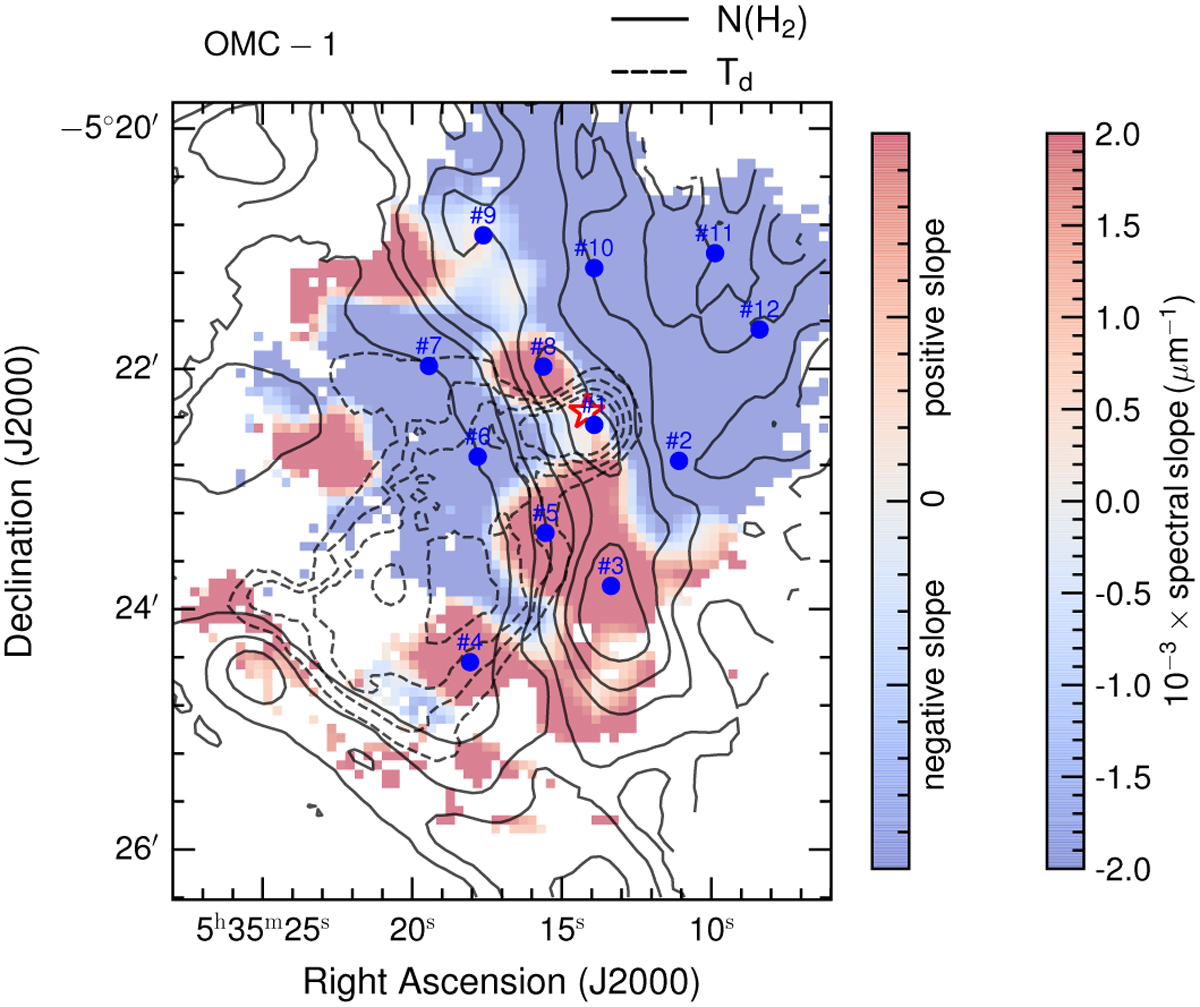
Spatial distribution of the spectral slope of the polarisation spectrum in OMC-1. The reddish region shows a rising polarisation spectrum, whereas the blueish region shows a spectrum with a falling slope. This map is overlayed with dust temperature (solid black lines with Td ≥ 60 K with a step of 5 K) and gas density (dashed black line with N(H2) = 1, 2, 3, 6, 10, 20 × 1022 cm−2 or AV ≥ 12.4 magnitude). The blue dots indicate the 12 positions where the spectra are used to compare with numerical models.
Current usage metrics show cumulative count of Article Views (full-text article views including HTML views, PDF and ePub downloads, according to the available data) and Abstracts Views on Vision4Press platform.
Data correspond to usage on the plateform after 2015. The current usage metrics is available 48-96 hours after online publication and is updated daily on week days.
Initial download of the metrics may take a while.