Fig. 1
Download original image
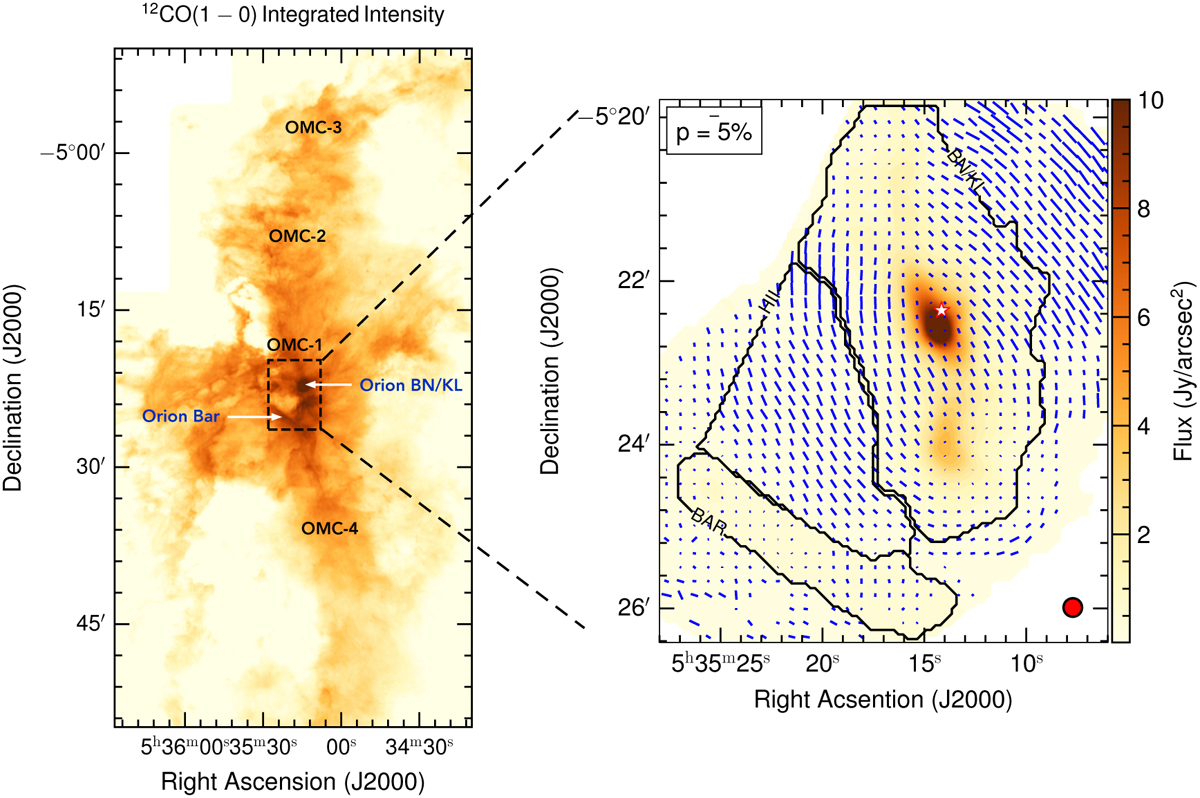
Map showing the intensity of 12CO(1–0) integrated over the OMC A cloud, which is bounded by OMC-3 in the north and OMC-4 in the south (left). The focus region in this study is indicated by the black box. Thermal dust polarisation was observed at a wavelength of 54 µm using SOFIA/HAWC+ (right). The background colour represents the total continuum intensity (Stokes-I). The blue segments indicate the orientation of the polarisation (E-vectors), with their length indicating the degree of polarisation. The black contour lines outline the Orion BN/KL, HII, and Bar. The red asterisk marks the location of the Orion BN/KL core. The CO data were obtained from the CARMA-NRO Orion Survey (Kong et al. 2018).
Current usage metrics show cumulative count of Article Views (full-text article views including HTML views, PDF and ePub downloads, according to the available data) and Abstracts Views on Vision4Press platform.
Data correspond to usage on the plateform after 2015. The current usage metrics is available 48-96 hours after online publication and is updated daily on week days.
Initial download of the metrics may take a while.