Fig. 8
Download original image
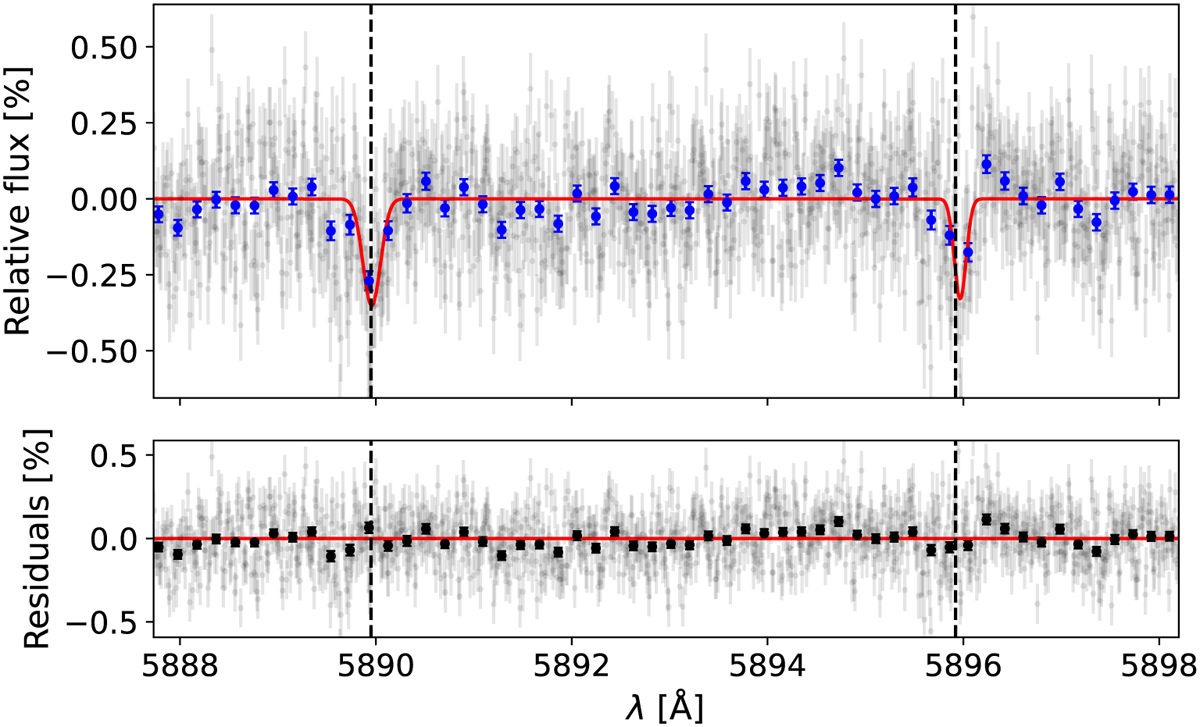
ESPRESSO transmission spectrum of WASP-178 b on the planetary rest frame around the Na I doublet. Top panel: the grey points represent the unbinned data, the blue points represent the data binned by x20 and the Gaussian fit to the sodium doublet lines is shown by the solid red line. The expected line centres are marked by the dashed black lines. Bottom panel: the residuals of the fit are shown, with the black dots corresponding to the binned data.
Current usage metrics show cumulative count of Article Views (full-text article views including HTML views, PDF and ePub downloads, according to the available data) and Abstracts Views on Vision4Press platform.
Data correspond to usage on the plateform after 2015. The current usage metrics is available 48-96 hours after online publication and is updated daily on week days.
Initial download of the metrics may take a while.