Fig. 7
Download original image
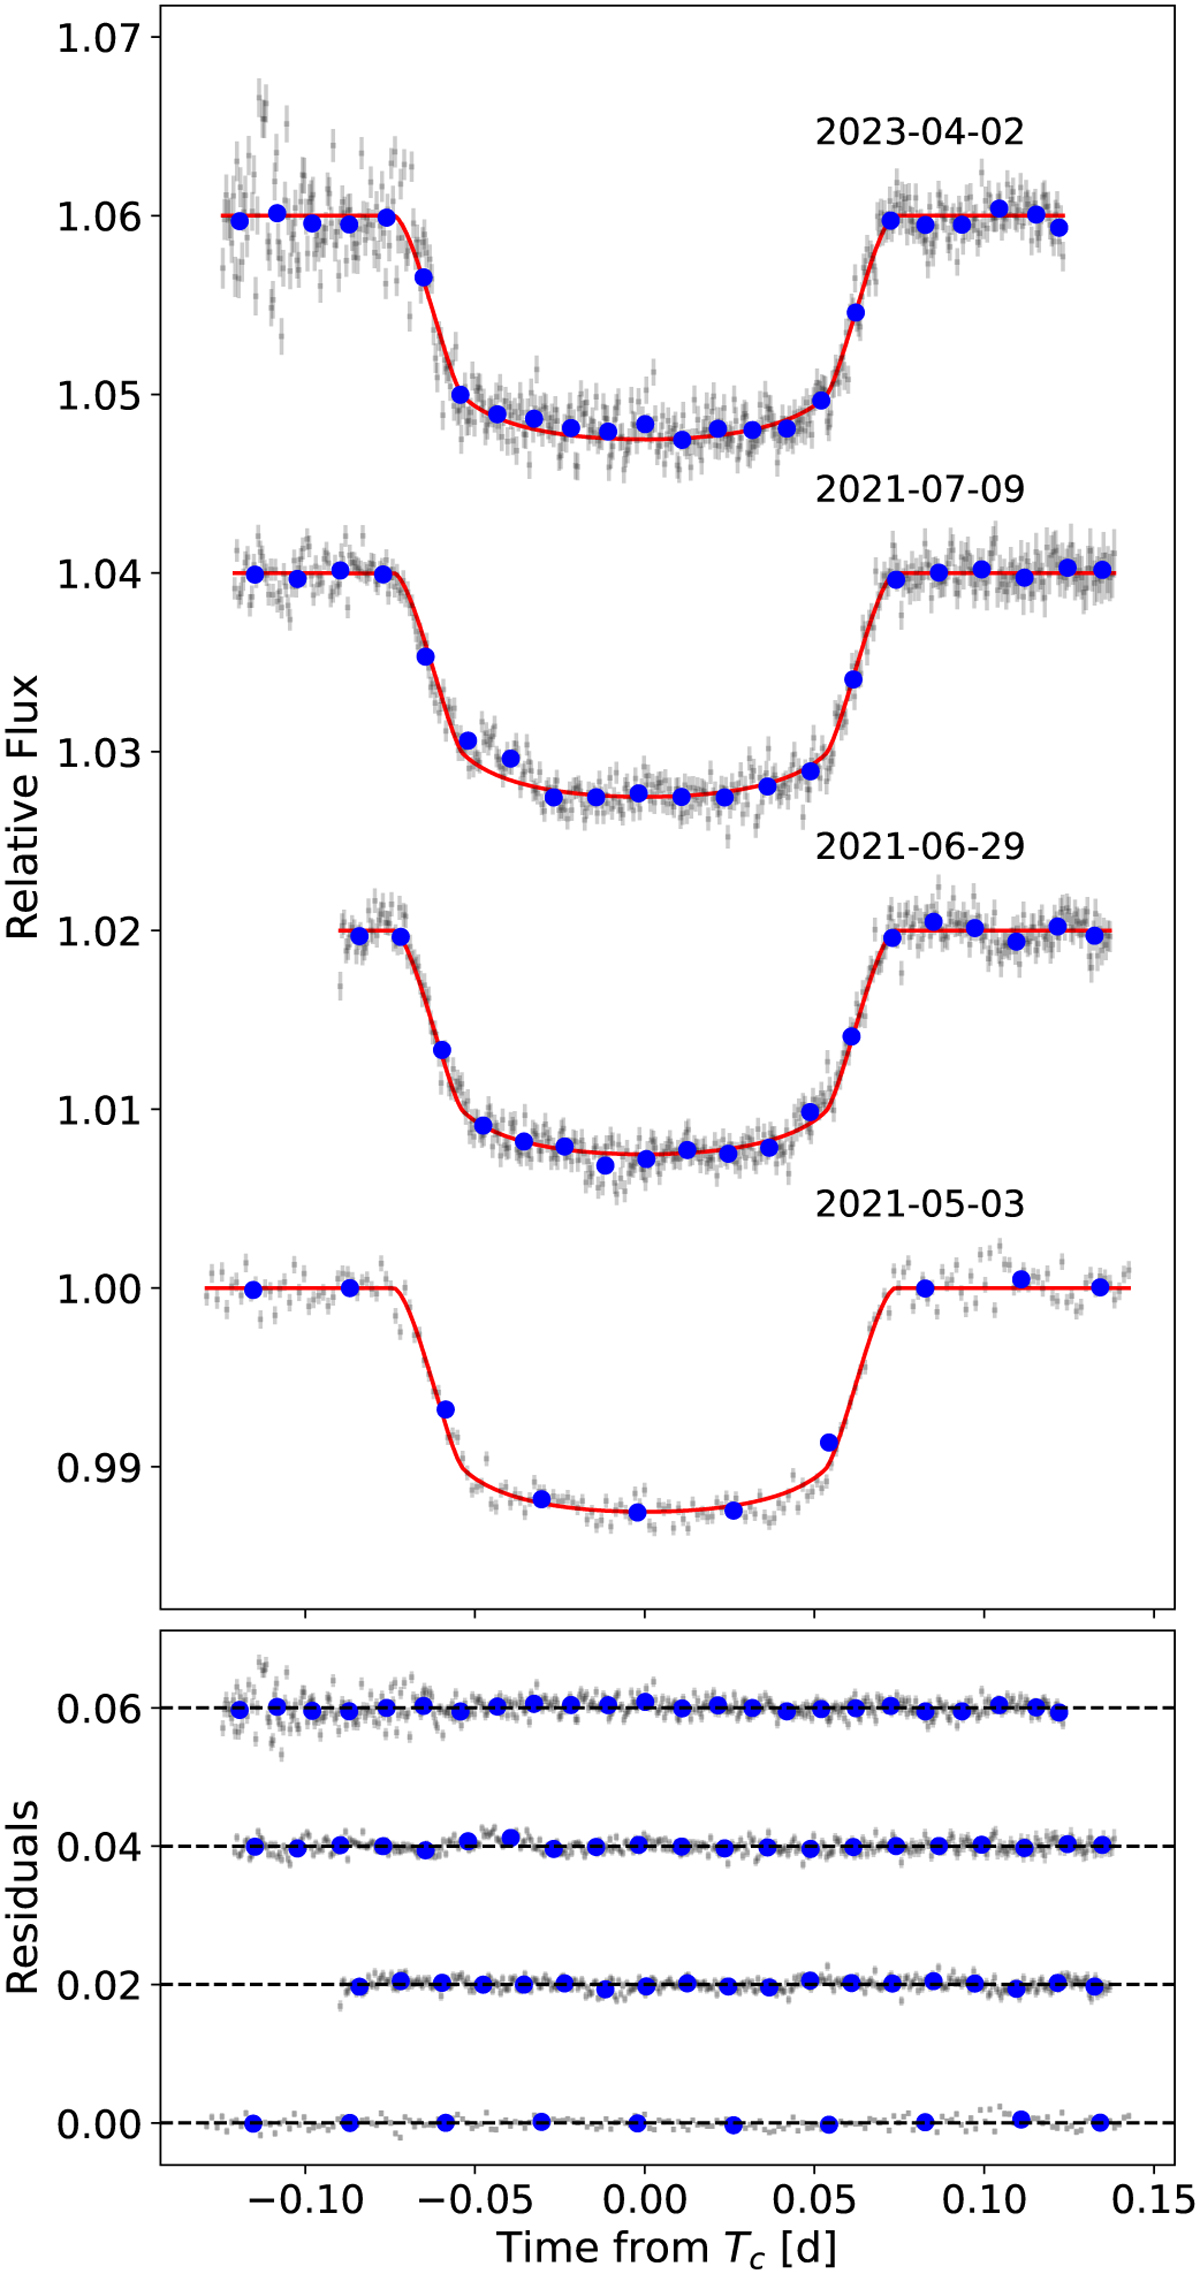
Four detrended EulerCam transit observations of WASP-178 b with an offset of 0.02 for visibility. In the top panel, the data are represented by the grey points and the best-fit model is represented by the red lines. The corresponding date is displayed above each set. The blue points correspond to the ×20 binned data. The bottom panel contains the residuals for each night relative to the dashed black line, in the same order.
Current usage metrics show cumulative count of Article Views (full-text article views including HTML views, PDF and ePub downloads, according to the available data) and Abstracts Views on Vision4Press platform.
Data correspond to usage on the plateform after 2015. The current usage metrics is available 48-96 hours after online publication and is updated daily on week days.
Initial download of the metrics may take a while.