Fig. 5
Download original image
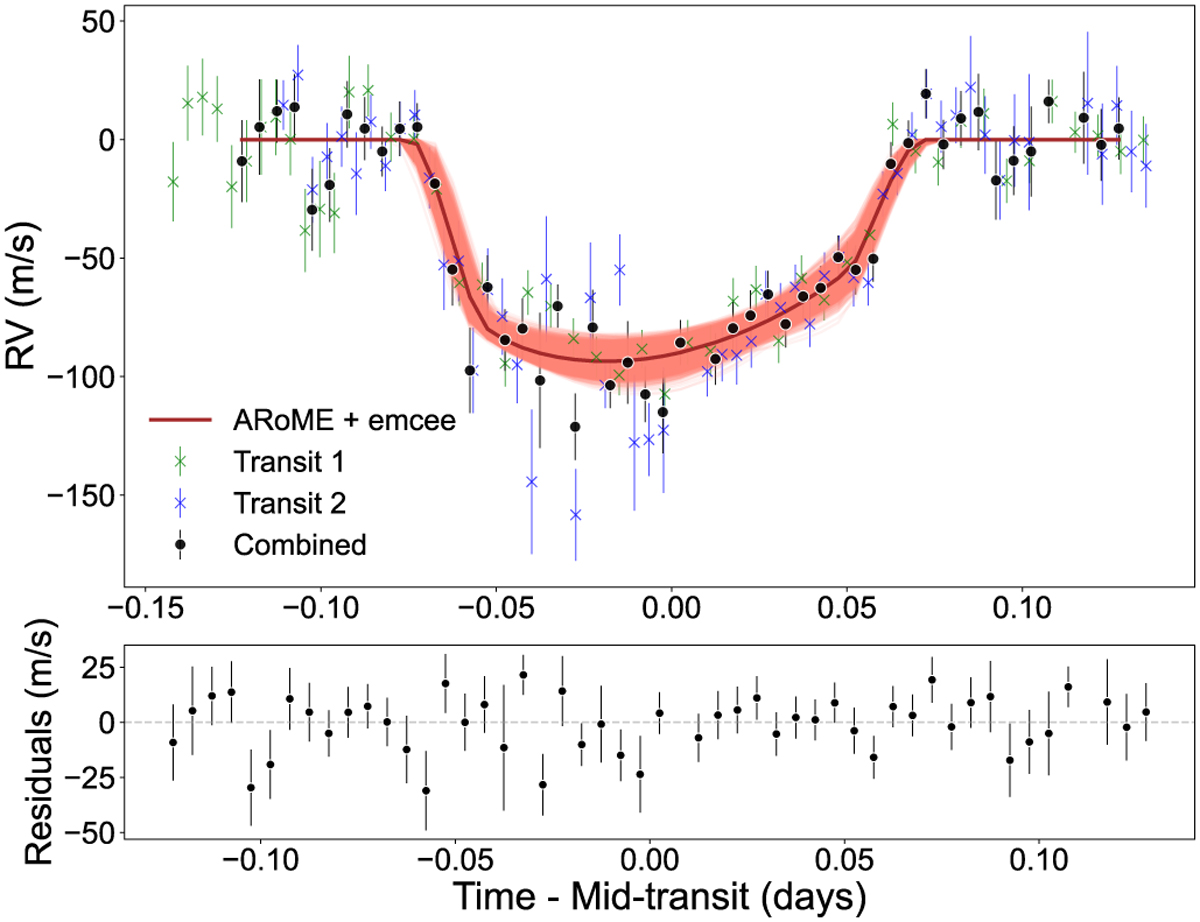
Rossiter-McLaughlin signal imprinted on the first transit (green crosses), second transit (blue crosses), and combined (black dots) RV time series. Additionally, we show in the top panel the best RM model from the ARoME + emcee fitting (magenta) and models within 1σ (light pink). The bottom panel contains the residuals of the combined RV time series.
Current usage metrics show cumulative count of Article Views (full-text article views including HTML views, PDF and ePub downloads, according to the available data) and Abstracts Views on Vision4Press platform.
Data correspond to usage on the plateform after 2015. The current usage metrics is available 48-96 hours after online publication and is updated daily on week days.
Initial download of the metrics may take a while.