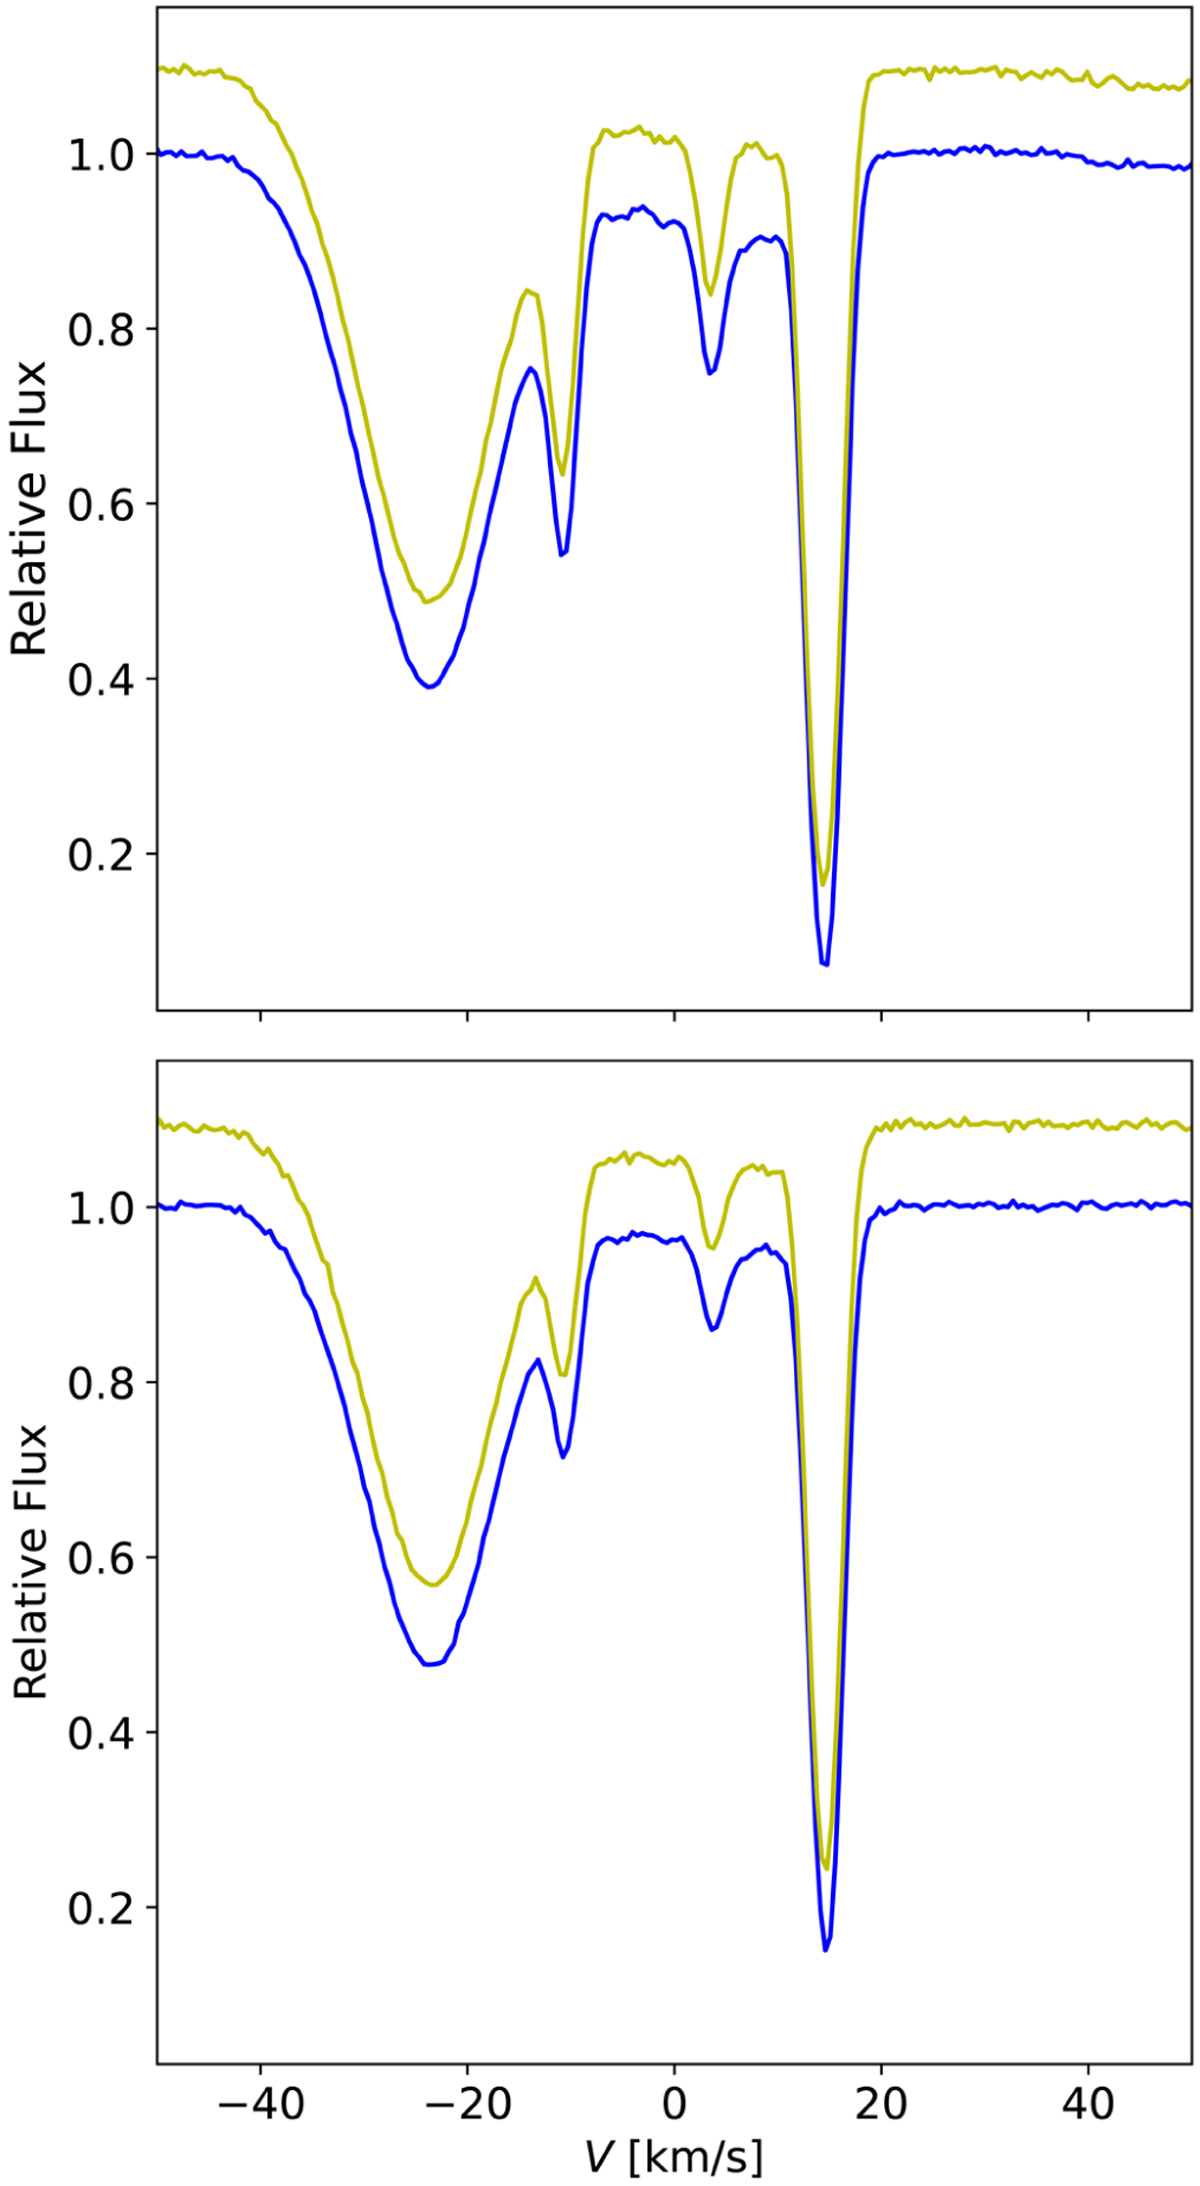
Fig. 4
Download original image
Average normalised spectrum for the first (solid blue line) and second (solid yellow line) transits, showing the vicinity of the sodium D2 (top panel) and Dl (bottom panel) lines. The yellow line is additionally offset for better visibility. The spectrum is shown as a function of the Doppler velocity with reference to the rest-frame wavelength of each line in the Solar System barycentre.
Current usage metrics show cumulative count of Article Views (full-text article views including HTML views, PDF and ePub downloads, according to the available data) and Abstracts Views on Vision4Press platform.
Data correspond to usage on the plateform after 2015. The current usage metrics is available 48-96 hours after online publication and is updated daily on week days.
Initial download of the metrics may take a while.