Fig. B.1
Download original image
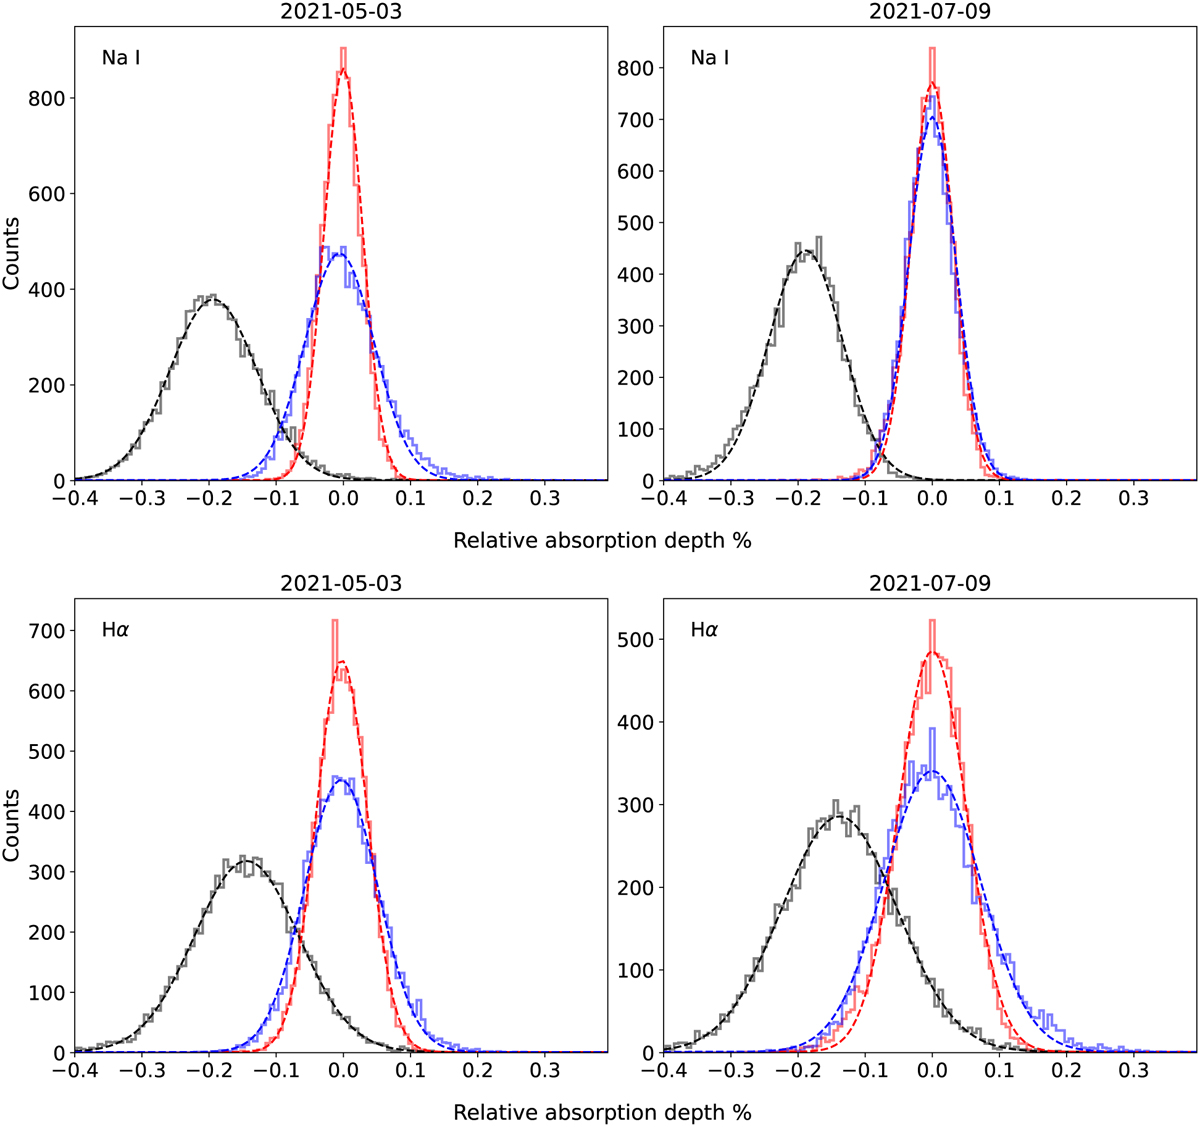
Distributions of the empirical Monte Carlo analysis for the 12 Å passband on the Na I doublet (top panels) and 10 Å on Hα (bottom panels), for each of the ESPRESSO transits. The results from the first and second night are displayed in the left and right panels, respectively. The distributions representing the in-in (red bins) and out-out (blue bins) scenarios are centred at zero, corresponding to non-detections, as expected. The in-out distributions (black bins) for Na I and Hα deviate from zero in both transits, indicating a detection of planetary origin. The Gaussian fits to the histograms are shown as dashed lines of the respective colour.
Current usage metrics show cumulative count of Article Views (full-text article views including HTML views, PDF and ePub downloads, according to the available data) and Abstracts Views on Vision4Press platform.
Data correspond to usage on the plateform after 2015. The current usage metrics is available 48-96 hours after online publication and is updated daily on week days.
Initial download of the metrics may take a while.