Fig. 14
Download original image
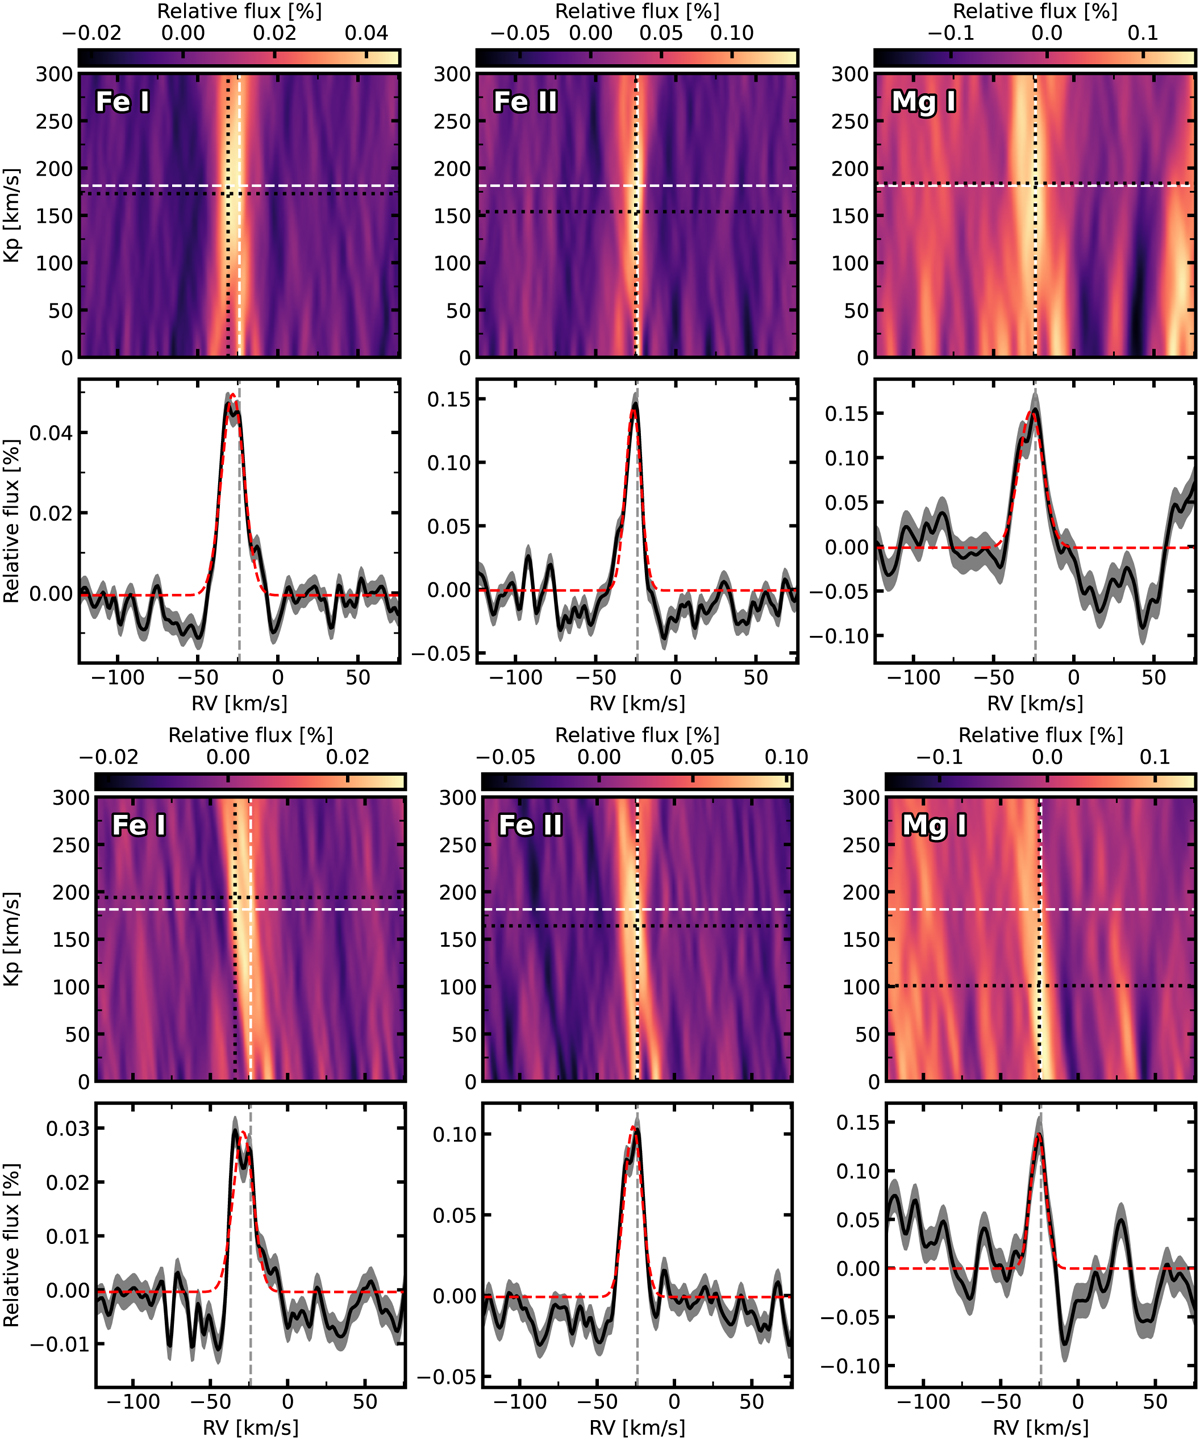
Cross-correlation analysis results of the first (2021 May 3, top) and second (2021 July 9, bottom) transit. From left to right, we searched for Fe I, Fe II, and Mg I. Top panel: expected velocities (white lines), and the detected location in the Kp −Vsys space (black lines). Bottom panel: extracted one-dimensional cross-correlation function at the detected location (horizontal black line). The dashed red lines show the best-fit Gaussian. The vertical black line shows the expected rest frame velocity, indicating blueshifts for all the detected species.
Current usage metrics show cumulative count of Article Views (full-text article views including HTML views, PDF and ePub downloads, according to the available data) and Abstracts Views on Vision4Press platform.
Data correspond to usage on the plateform after 2015. The current usage metrics is available 48-96 hours after online publication and is updated daily on week days.
Initial download of the metrics may take a while.