Fig. 8
Download original image
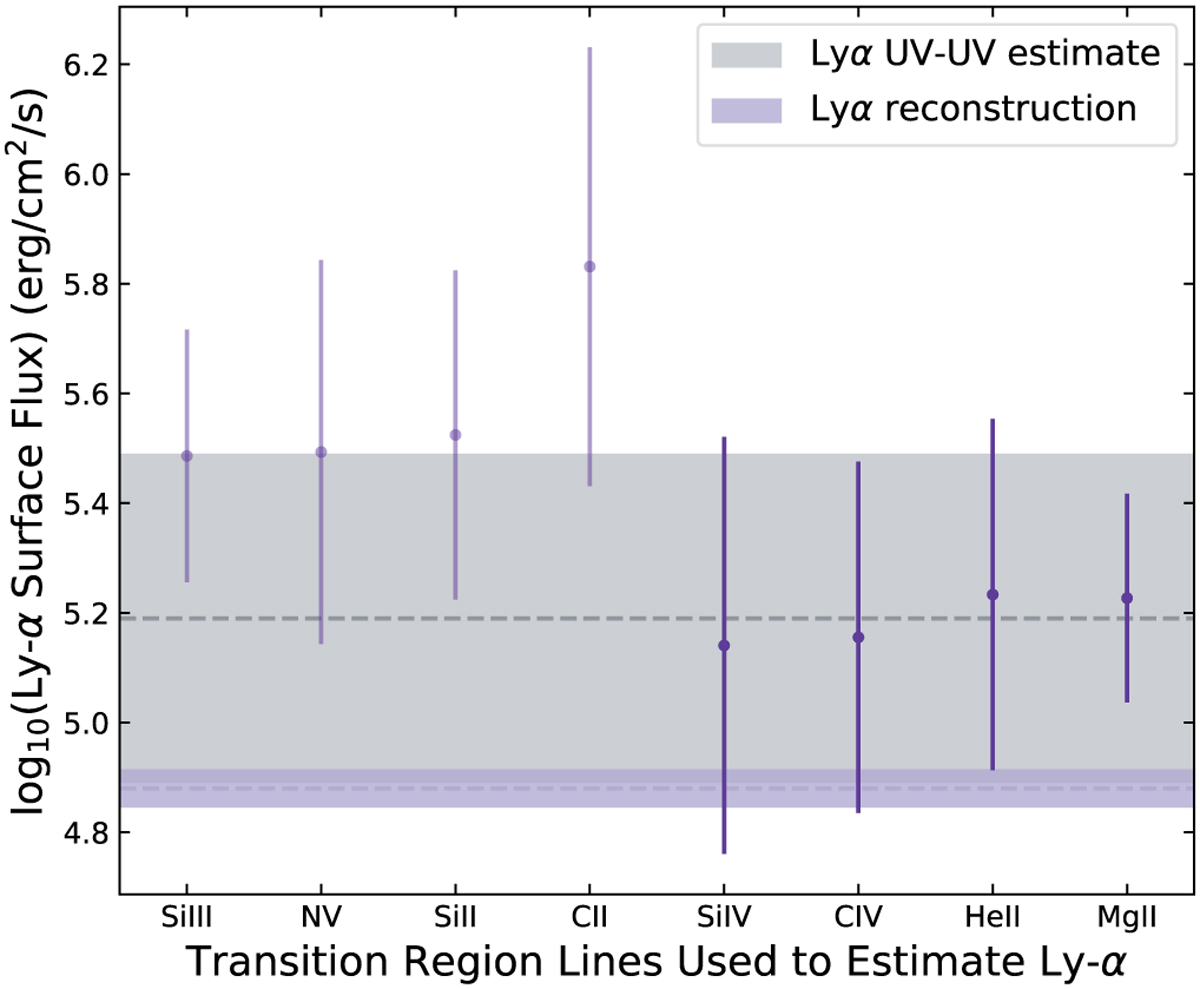
Same as Fig. 7 but for GJ 486. In this case, we find a discrepancy between the lines observed with COS/G130M and those observed with COS/G160M and COS/G230L. It is possible that this discrepancy is due to the large flares observed during the COS/G130M observations. We only use lines observed with COS/G160M and COS/G230L (darker purple points with 1σ errors) to estimate the Lyα flux with the UV– UV correlation method. The Lyα values from the reconstruction and the UV–UV estimation agree to within 2σ.
Current usage metrics show cumulative count of Article Views (full-text article views including HTML views, PDF and ePub downloads, according to the available data) and Abstracts Views on Vision4Press platform.
Data correspond to usage on the plateform after 2015. The current usage metrics is available 48-96 hours after online publication and is updated daily on week days.
Initial download of the metrics may take a while.