Fig. 7
Download original image
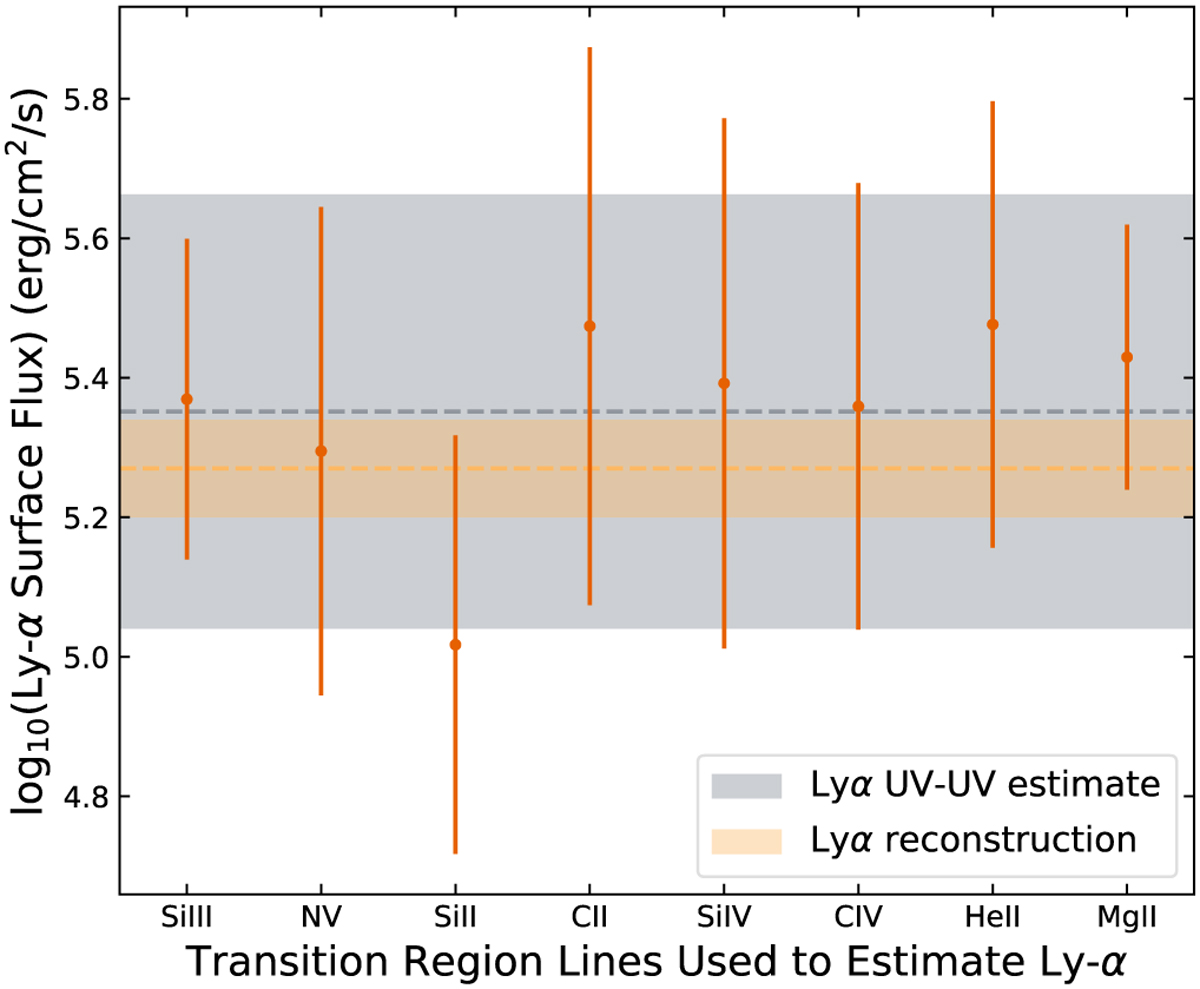
Deriving the Lyα flux of LTT 1445A using a reconstruction from the wings of the Lyα profile observed with the STIS/G140M grating (orange 1σ band; Youngblood et al. 2016) and using UV-UV line correlations with other measured UV lines with the COS instrument (orange points with 1σ errors, and the average 1 σ gray band; Youngblood et al. 2017; Diamond-Lowe et al. 2021, 2022). In the case of LTT 1445A, we find that individual transition region lines agree with each other, and with the reconstructed value.
Current usage metrics show cumulative count of Article Views (full-text article views including HTML views, PDF and ePub downloads, according to the available data) and Abstracts Views on Vision4Press platform.
Data correspond to usage on the plateform after 2015. The current usage metrics is available 48-96 hours after online publication and is updated daily on week days.
Initial download of the metrics may take a while.