Fig. 17
Download original image
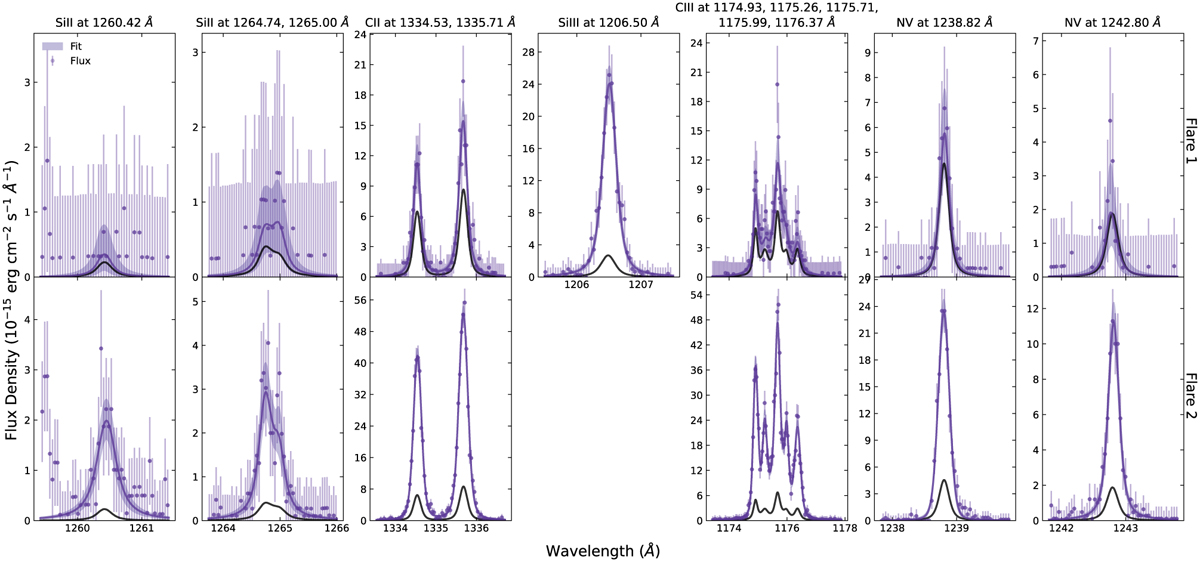
Transition region lines detected with COS/G130M for GJ 486 during the two observed flares. The purple line profiles and fits are constructed from data taken during the “in flare” phase of each flare. The black line profiles are the quiescent states; they are the same quiescent profiles in the top and bottom rows, but note the change in y-axes. Flare 2 was observed using FP-POS 4, which misses the Si III line at 1206.5 Å.
Current usage metrics show cumulative count of Article Views (full-text article views including HTML views, PDF and ePub downloads, according to the available data) and Abstracts Views on Vision4Press platform.
Data correspond to usage on the plateform after 2015. The current usage metrics is available 48-96 hours after online publication and is updated daily on week days.
Initial download of the metrics may take a while.