Fig. 16
Download original image
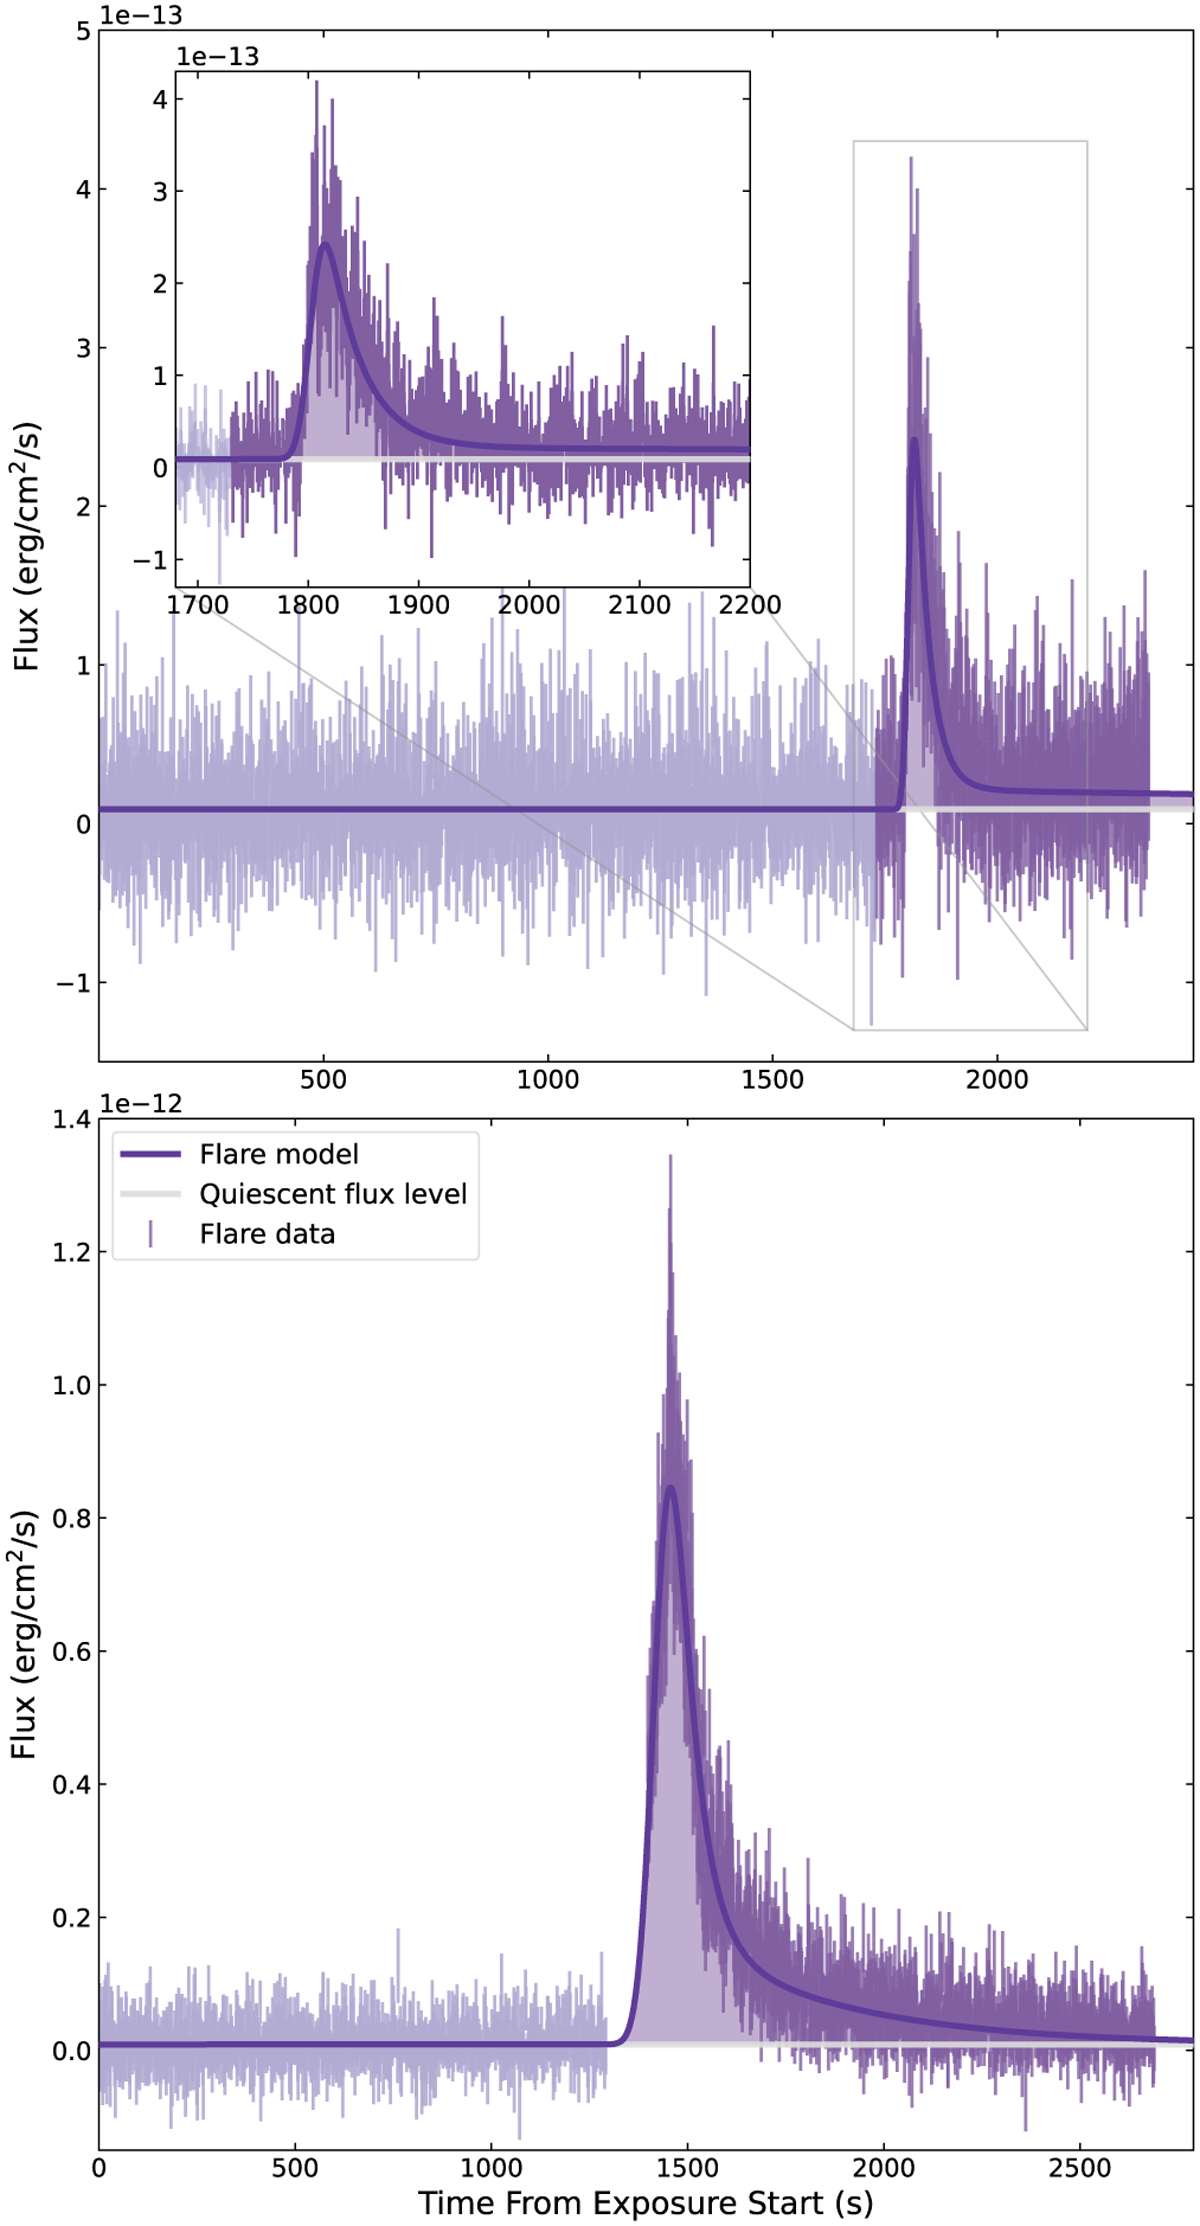
We detected two flares in the time series of the COS/G130M data for GJ 486. Dark purple points highlight the data that we consider to be “in flare”, as opposed to the lighter purple “quiescent” data. Dark purple lines are the best-fit flare models (Eq. (1), Table 8), created from a continuous flare model based on the work of Tovar Mendoza et al. (2022). The first flare (Flare 1; top) has an absolute energy of 1029.5 erg and an equivalent duration of 4357±96 s, while the second flare (Flare 2; bottom) is larger, with an absolute energy of 1030.1 erg and an equivalent duration of 19 724 ± 169 s.
Current usage metrics show cumulative count of Article Views (full-text article views including HTML views, PDF and ePub downloads, according to the available data) and Abstracts Views on Vision4Press platform.
Data correspond to usage on the plateform after 2015. The current usage metrics is available 48-96 hours after online publication and is updated daily on week days.
Initial download of the metrics may take a while.