Fig. 1
Download original image
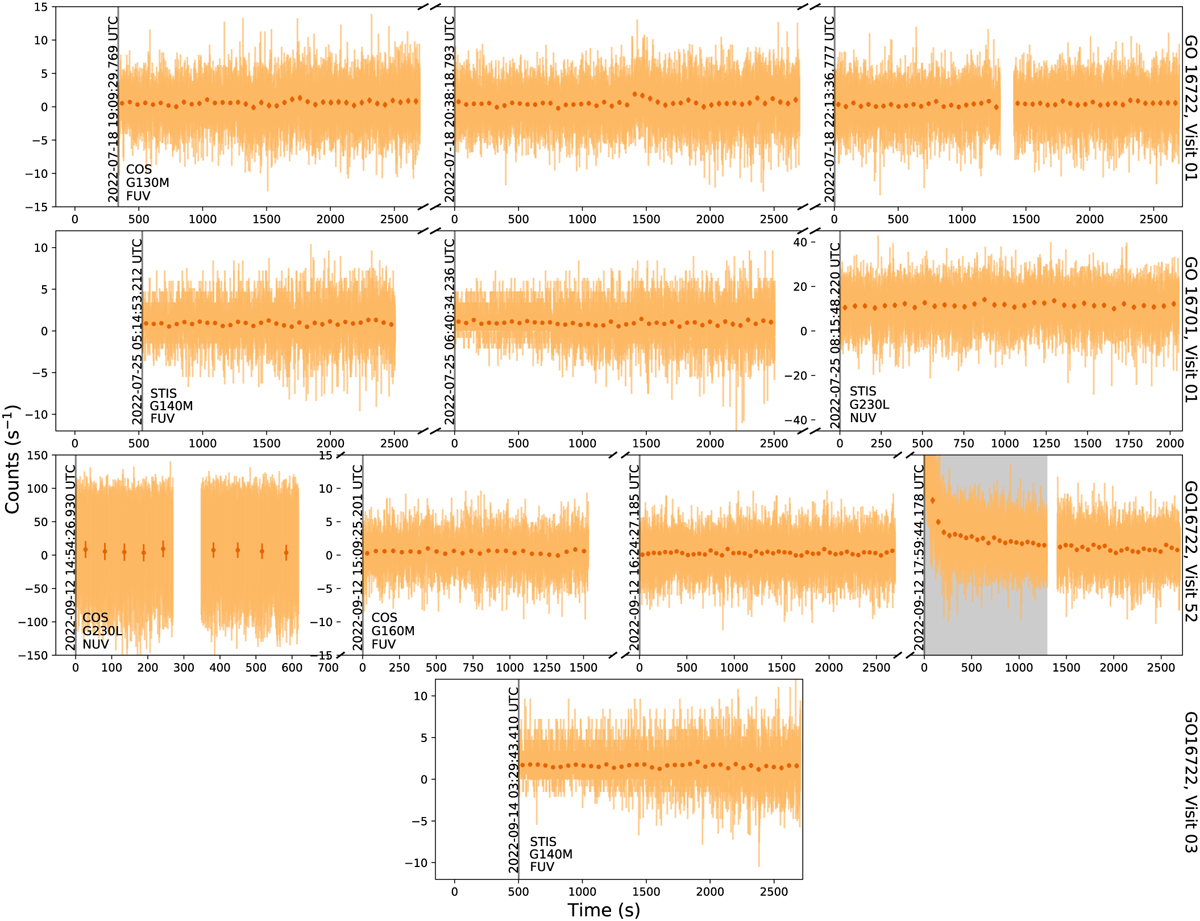
Time series of LTT 1445A observations used in this analysis from GO Programs 16722 and 16701 (program and visit number specified on right-hand side) presented in chronological order. Count rates are provided in 1 s time bins (light orange) and 1 min time bins (dark orange). The instrument, grating, and detector are given in the first panel of a set of exposures. The shaded gray region shows a flare; these data are excluded from the panchromatic spectrum (Sect. 4) but we analyze the flare data separately in Sect. 5.
Current usage metrics show cumulative count of Article Views (full-text article views including HTML views, PDF and ePub downloads, according to the available data) and Abstracts Views on Vision4Press platform.
Data correspond to usage on the plateform after 2015. The current usage metrics is available 48-96 hours after online publication and is updated daily on week days.
Initial download of the metrics may take a while.