Fig. 1.
Download original image
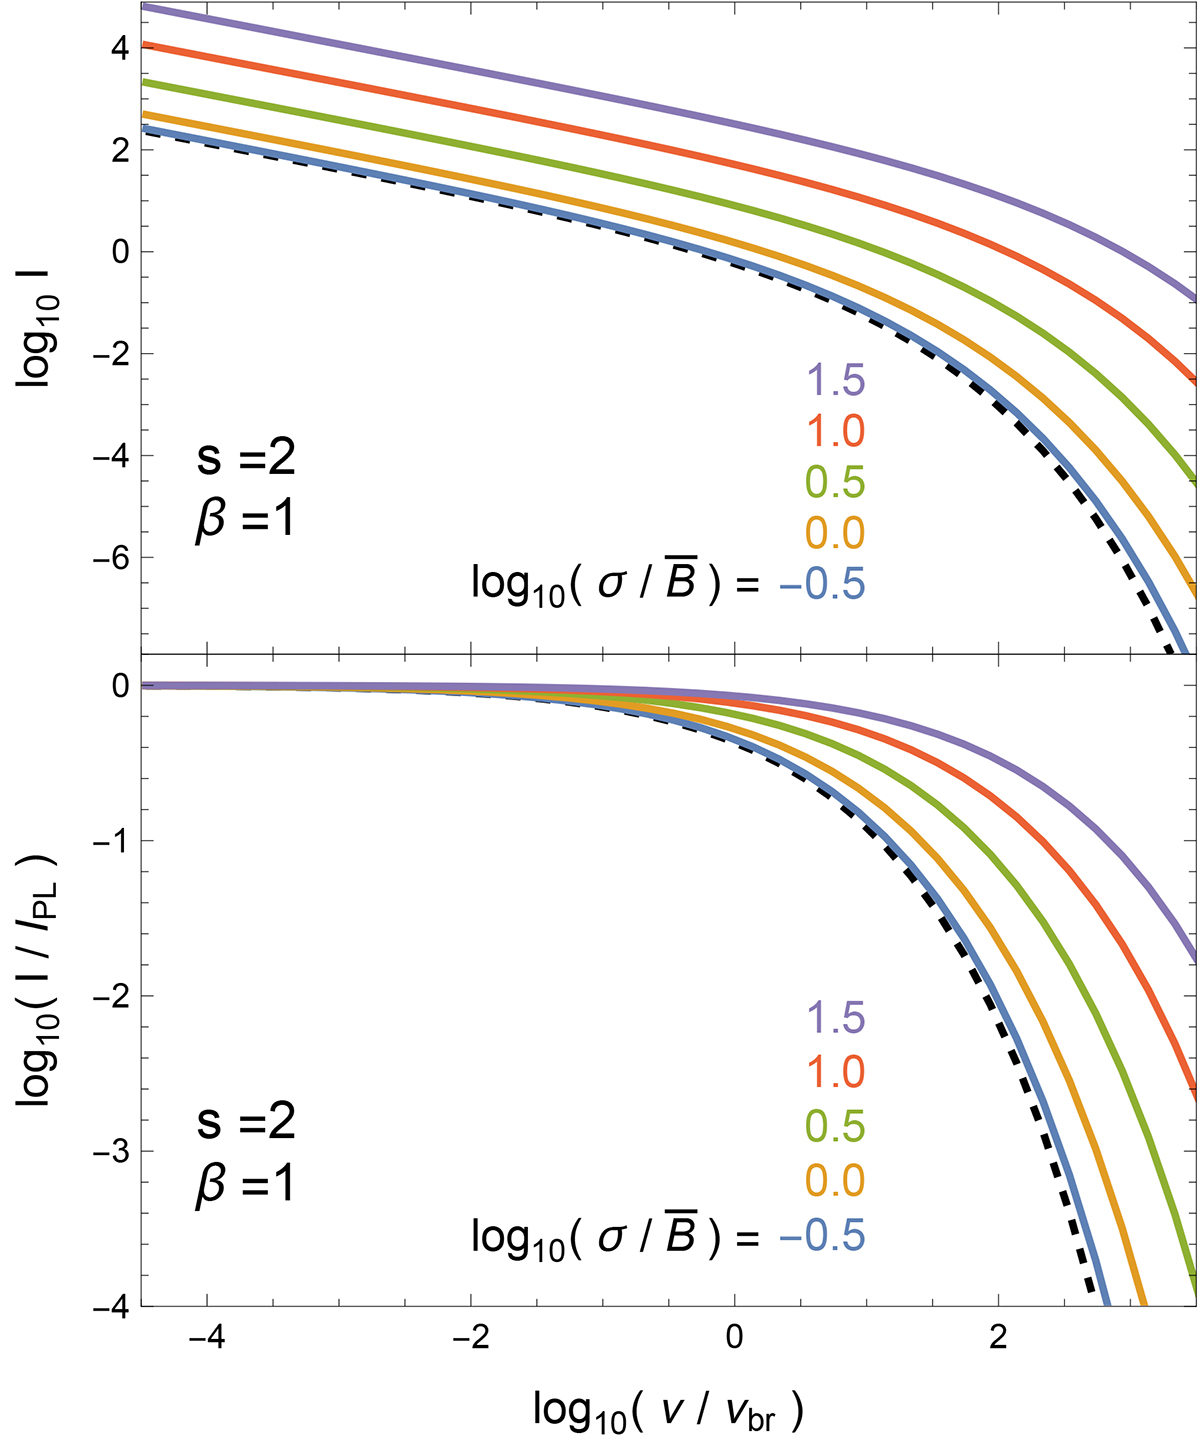
Spectral behavior of the total intensity, for some choices of parameters. Upper panel: Spectra of ℐ, for a fixed choice of s (=2) and β (=1), and different choices of the level of the random MF, here isotropic and characterized by the standard deviation σ. ℐ is normalized by taking ![]() in Eqs. (11) and (18). The dashed line represents the case without random MF, while the other colored lines refer to values of
in Eqs. (11) and (18). The dashed line represents the case without random MF, while the other colored lines refer to values of ![]() ranging between −0.5 and +1.5, in steps of 0.5. Lower panel: Same as above, but scaled with the pure power-law solution from Paper I.
ranging between −0.5 and +1.5, in steps of 0.5. Lower panel: Same as above, but scaled with the pure power-law solution from Paper I.
Current usage metrics show cumulative count of Article Views (full-text article views including HTML views, PDF and ePub downloads, according to the available data) and Abstracts Views on Vision4Press platform.
Data correspond to usage on the plateform after 2015. The current usage metrics is available 48-96 hours after online publication and is updated daily on week days.
Initial download of the metrics may take a while.