Fig. 6
Download original image
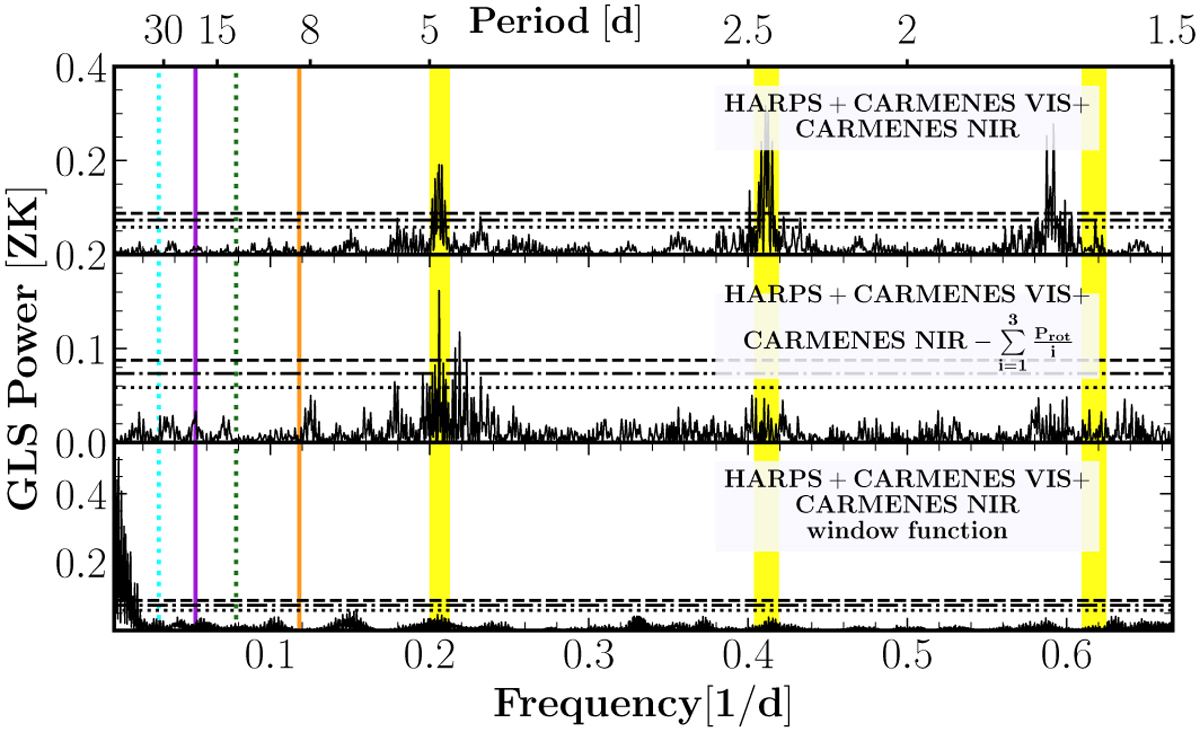
GLS periodograms of combination of CARMENES VIS, CARMENES NIR, and HARPS datasets. The top, middle, and bottom panels show the GLS periodogram, the GLS periodogram of the residuals after applying the pre-whitening method, and the GLS periodogram of the window function, respectively. The stellar rotation period and its second and third harmonics are shown as vertical yellow bands, centred at 0.206 d−1 (4.9 d), 0.410 d−1 (2.5 d), and 0.617 d−1 (1.6 d). The vertical orange and purple lines indicate the orbital period of planets b and c. The vertical green and cyan dotted lines indicate the orbital period of candidates d and e, respectively. The dashed horizontal black lines corresponds to the FAP levels of 10%, 1%, and 0.1% (from top to bottom).
Current usage metrics show cumulative count of Article Views (full-text article views including HTML views, PDF and ePub downloads, according to the available data) and Abstracts Views on Vision4Press platform.
Data correspond to usage on the plateform after 2015. The current usage metrics is available 48-96 hours after online publication and is updated daily on week days.
Initial download of the metrics may take a while.