Fig. 13
Download original image
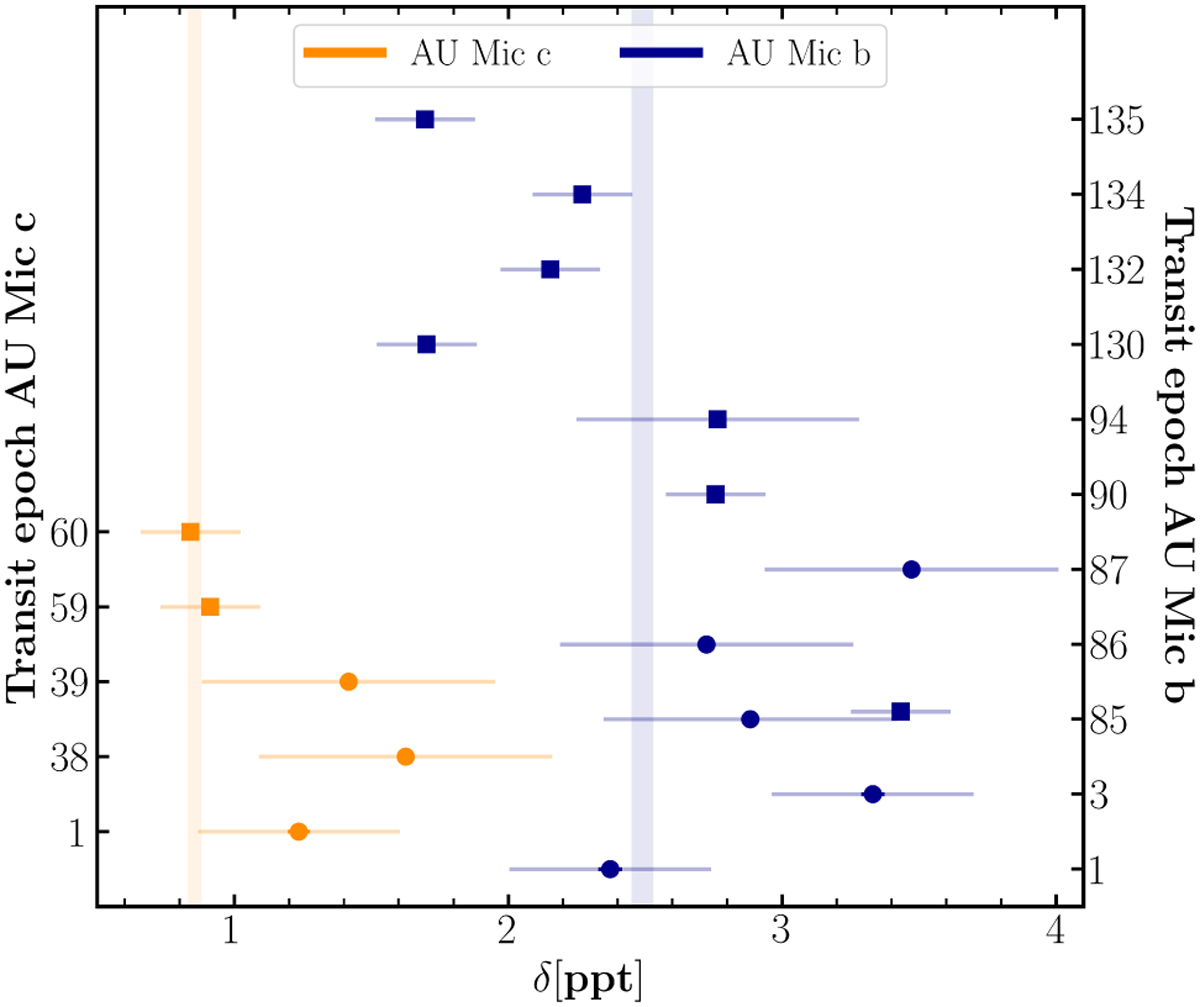
Transit depth determinations of AU Mic b (blue) and c (orange) for individual transits. The dot and square symbols represent the TESS and CHEOPS data, respectively. The vertical bands represent our transit depth determination from the joint fit. The opacity in the error bars of each measurement indicates the 1σ error of the posterior distribution (higher opacity) and the error of the jitter term (less opacity). The transit with epoch 85 was observed simultaneously with TESS and CHEOPS and is slightly shifted in the vertical axis for clarity.
Current usage metrics show cumulative count of Article Views (full-text article views including HTML views, PDF and ePub downloads, according to the available data) and Abstracts Views on Vision4Press platform.
Data correspond to usage on the plateform after 2015. The current usage metrics is available 48-96 hours after online publication and is updated daily on week days.
Initial download of the metrics may take a while.