Open Access
Fig. 7
Download original image
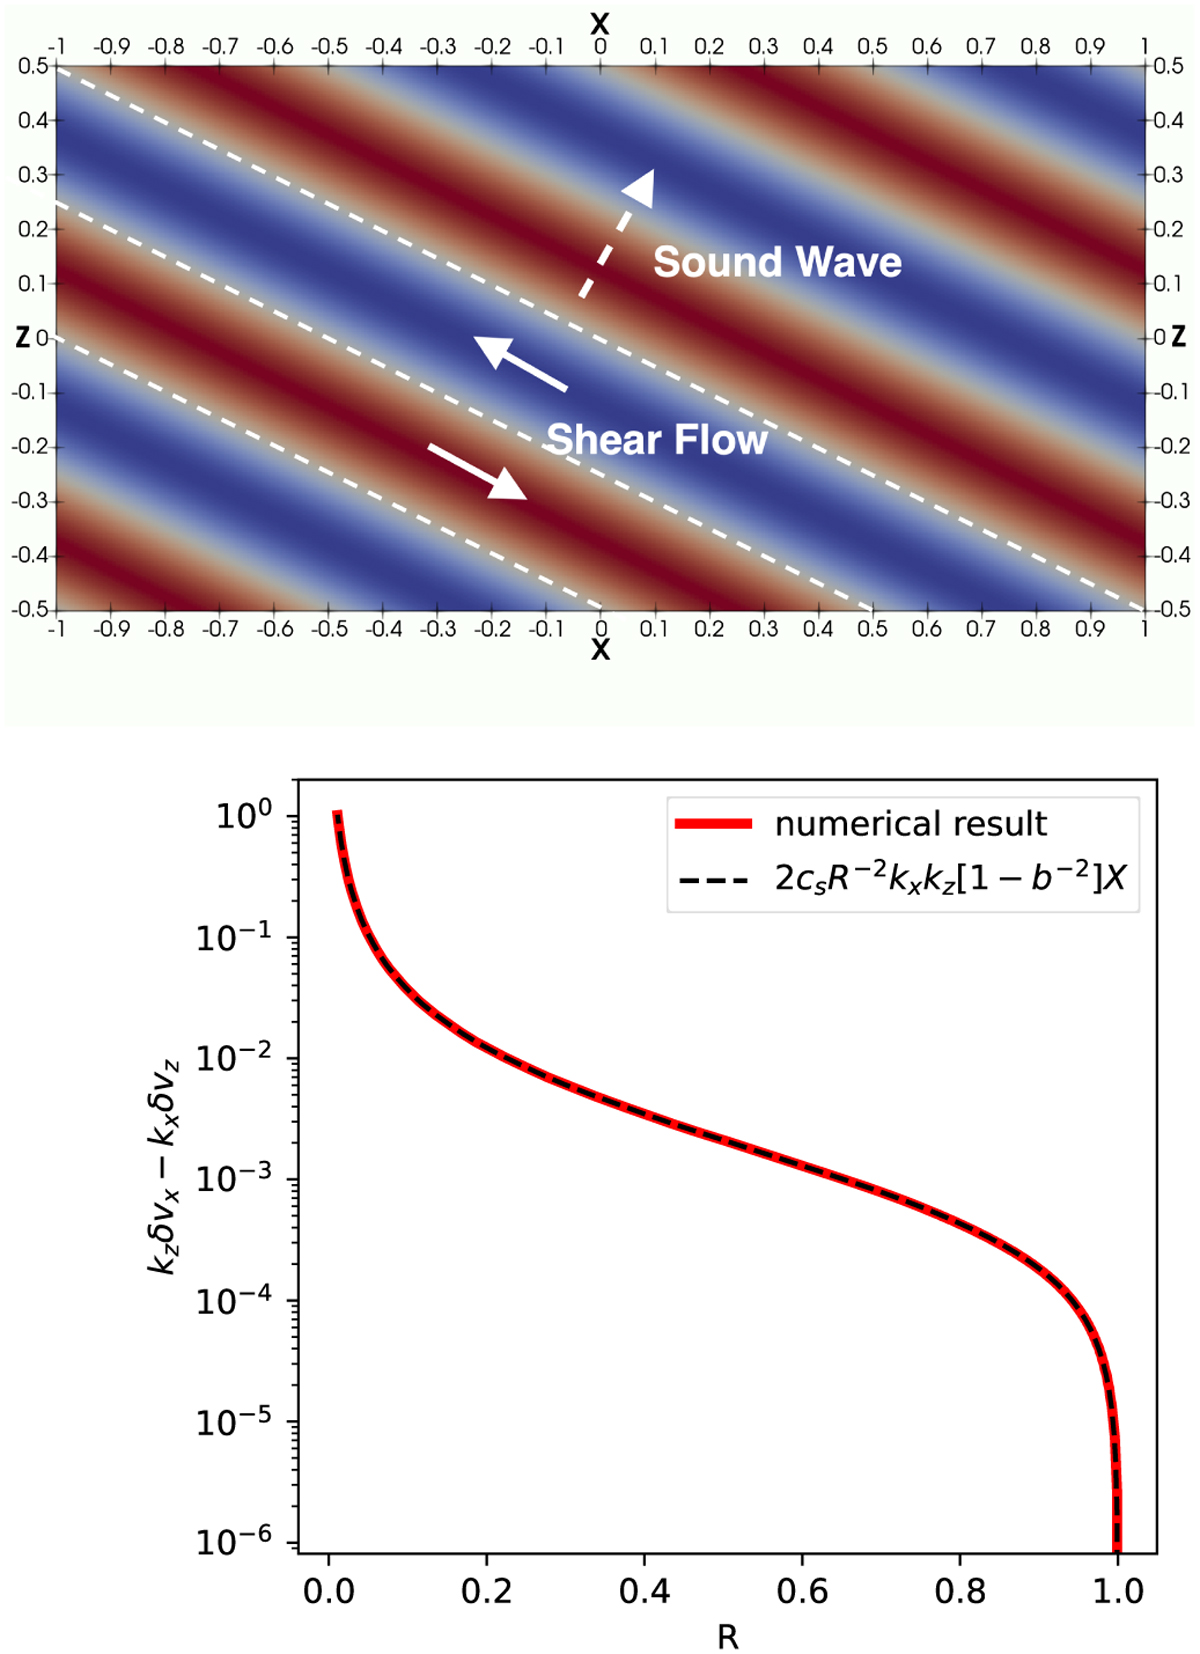
Test case for diagonal sound wave. Upper panel: illustration of the diagonal sound wave and the shear flow generated. Lower panel: amplitude of the shear flow generated by the wave as a function of R. The numerical result (solid red line) closely matches the analytical solution (dashed black line).
Current usage metrics show cumulative count of Article Views (full-text article views including HTML views, PDF and ePub downloads, according to the available data) and Abstracts Views on Vision4Press platform.
Data correspond to usage on the plateform after 2015. The current usage metrics is available 48-96 hours after online publication and is updated daily on week days.
Initial download of the metrics may take a while.