Fig. 6
Download original image
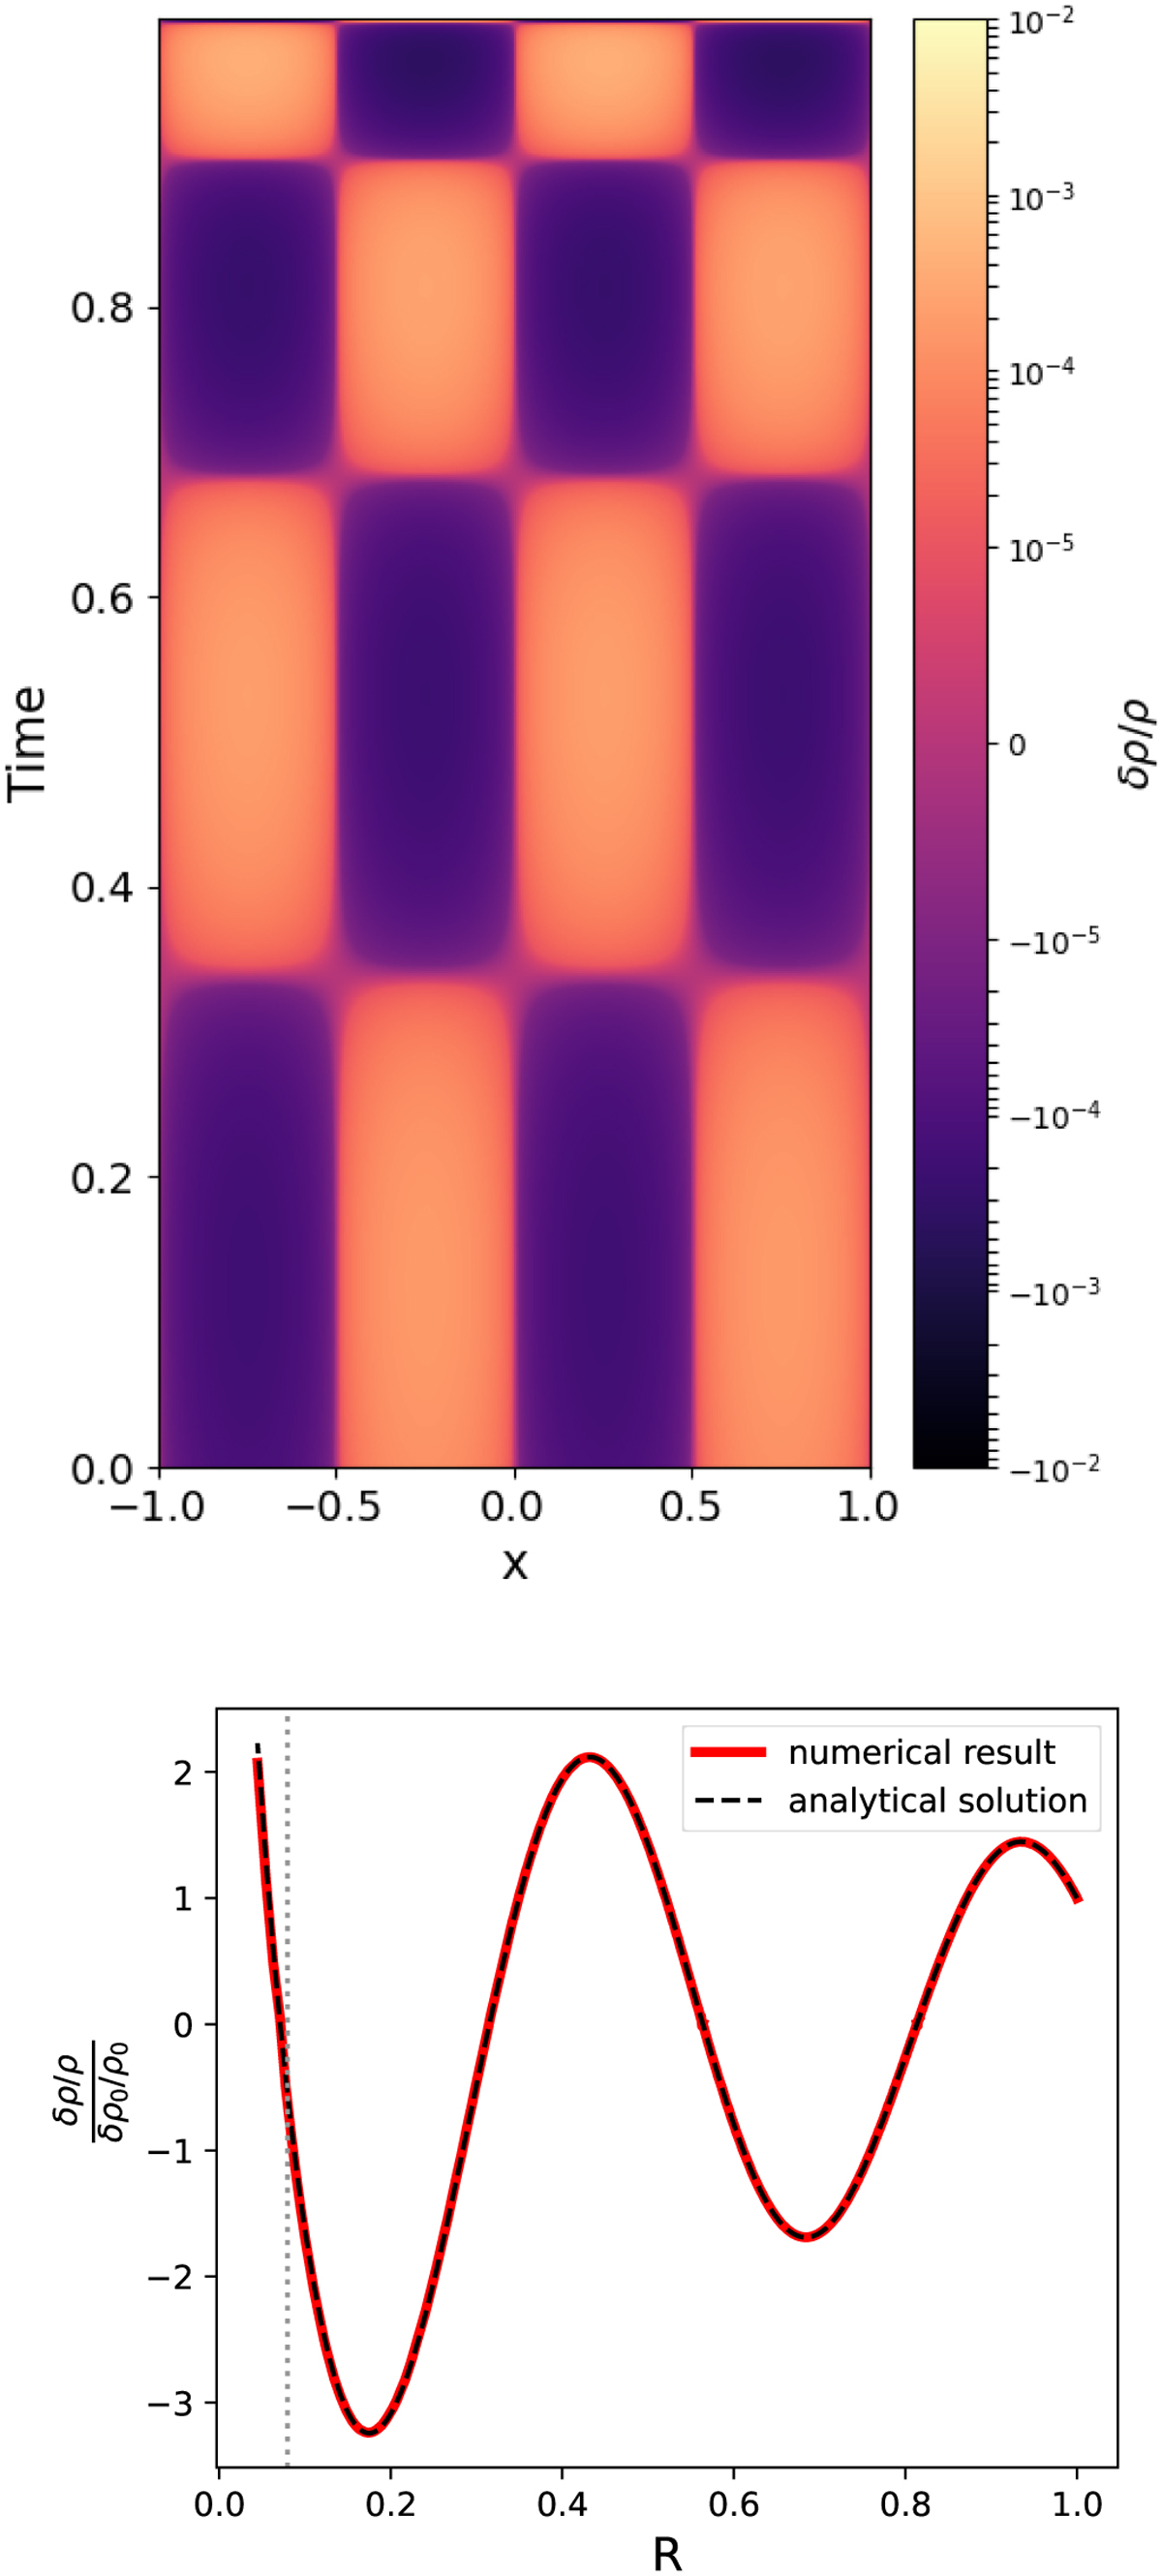
Test case of purely horizontal sound wave with a nonuniform collapse profile. Upper panel: space-time plot for vertically averaged relative density variation. Lower panel: relative amplitude of perturbation, δρ/ρ, as a function of R from the simulation (solid red line), consistent with the analytical solution (dashed black line). The vertical dotted line marks the length scale, Lfreezeout, corresponding to the freeze-out regime.
Current usage metrics show cumulative count of Article Views (full-text article views including HTML views, PDF and ePub downloads, according to the available data) and Abstracts Views on Vision4Press platform.
Data correspond to usage on the plateform after 2015. The current usage metrics is available 48-96 hours after online publication and is updated daily on week days.
Initial download of the metrics may take a while.