Fig. 2
Download original image
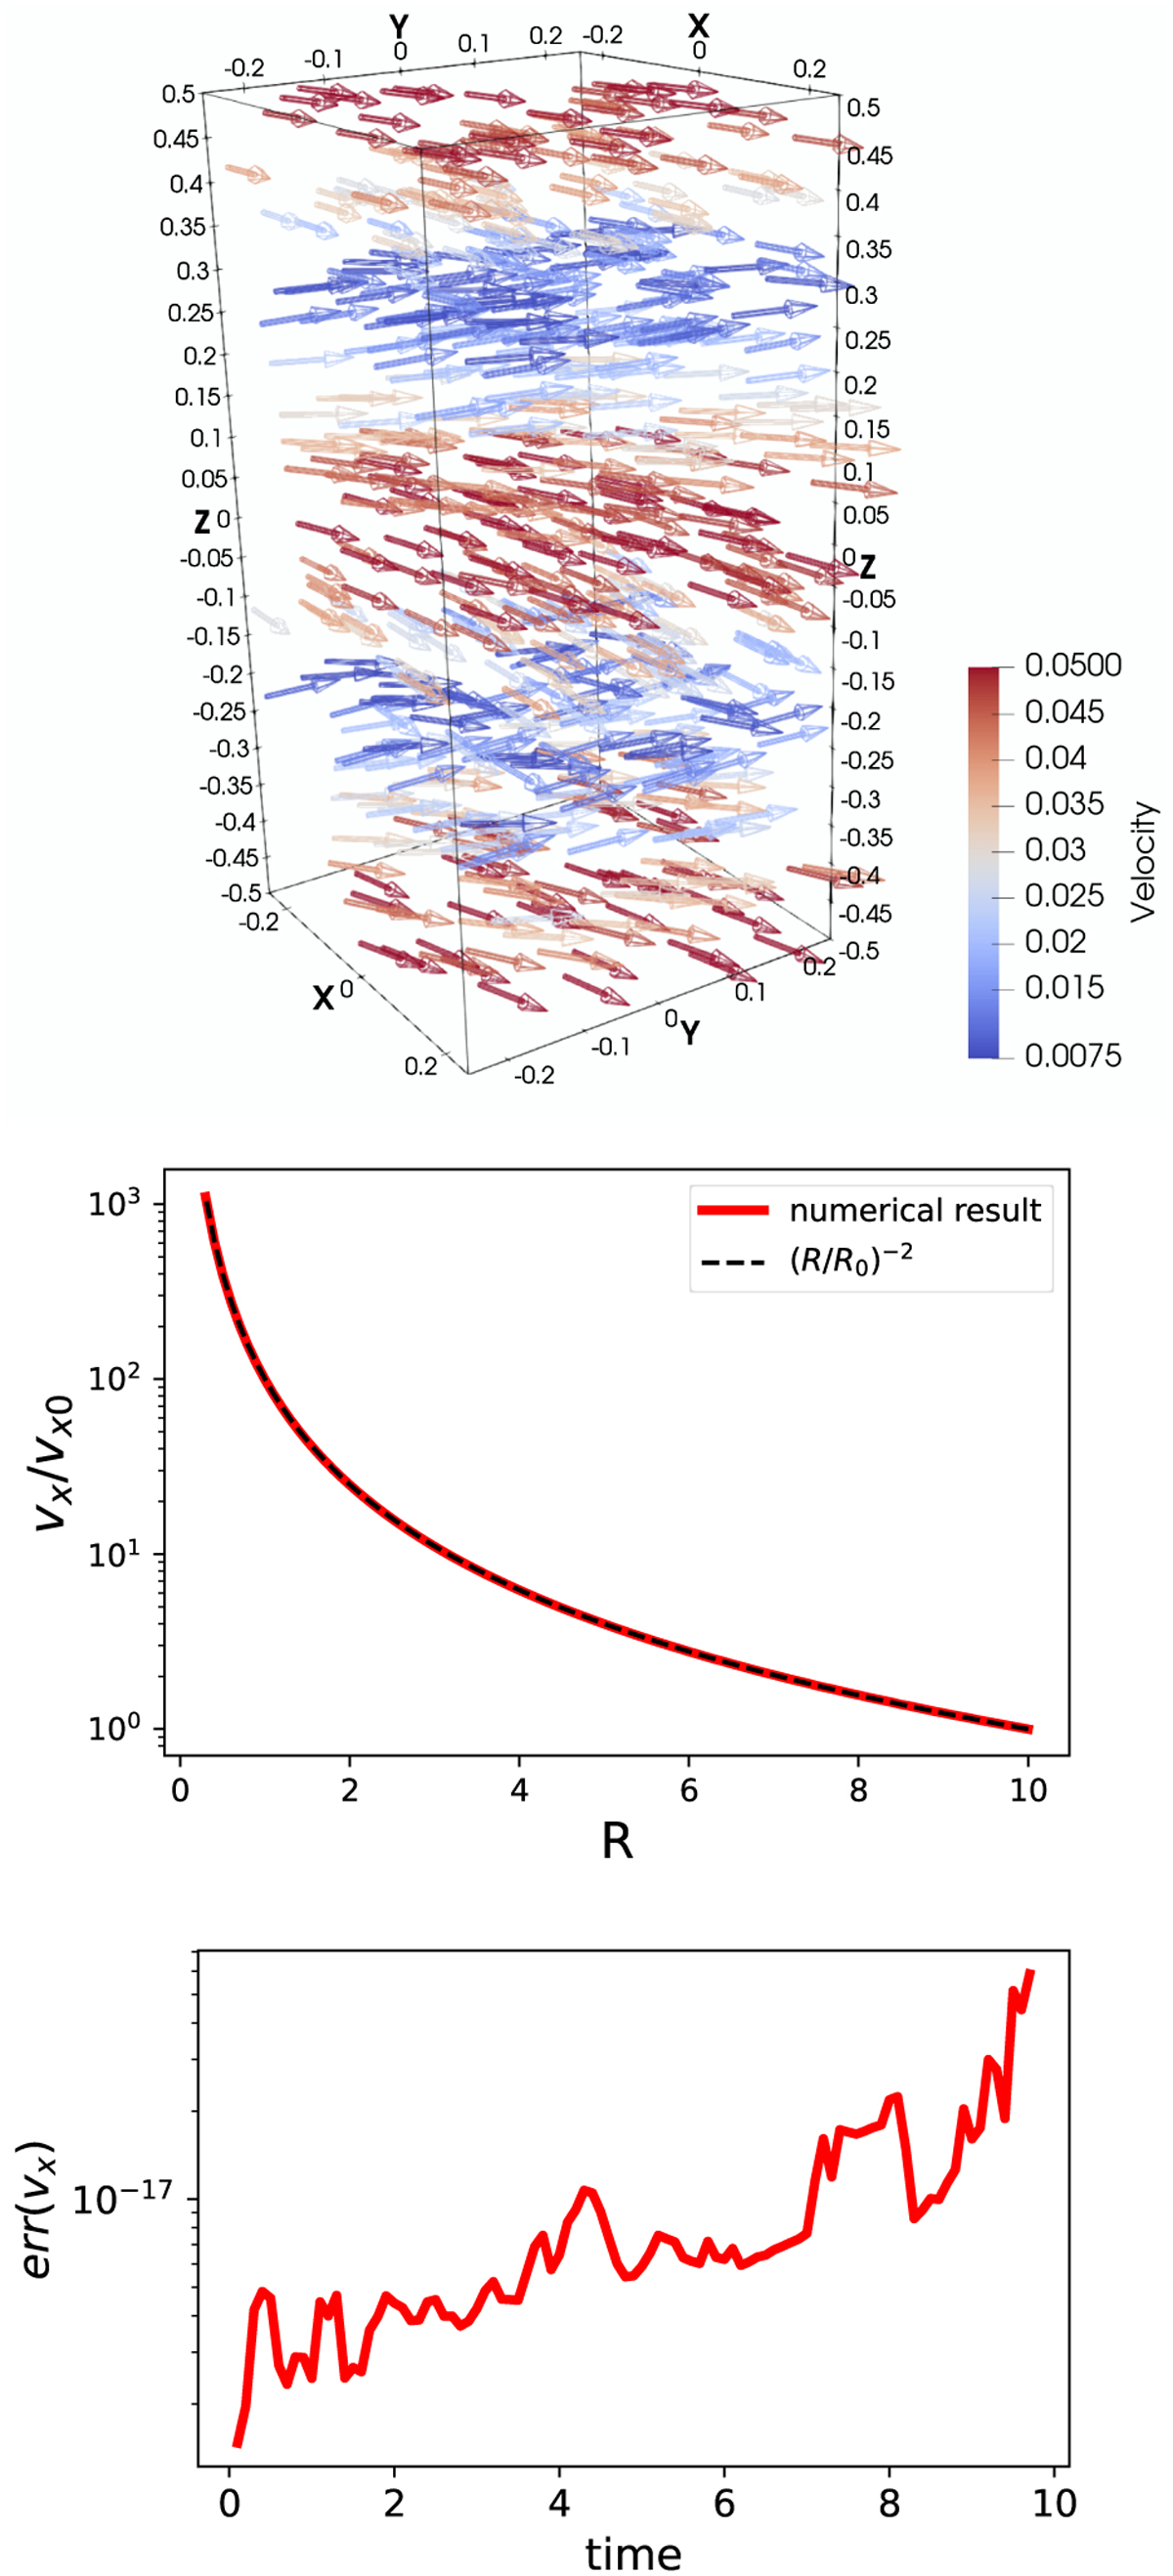
Test case of horizontal shear flows. Upper panel: 3D visualization of the initial spatial distribution of the shear flow in our simulation. Arrows mark the direction of shear flow, and the total flow velocity magnitude is mapped to colors (see the color bar). Middle panels: solid red line shows υx/υx0 vs. R, i.e., normalized shear velocity as a function of global radius of the local box, showing growth of shear velocity as collapse proceeds, closely matches the analytical expectation (dashed black lines). The result of υy is identical to that of υx and is not shown here. Lower panel: time evolution of relative error err(υx).
Current usage metrics show cumulative count of Article Views (full-text article views including HTML views, PDF and ePub downloads, according to the available data) and Abstracts Views on Vision4Press platform.
Data correspond to usage on the plateform after 2015. The current usage metrics is available 48-96 hours after online publication and is updated daily on week days.
Initial download of the metrics may take a while.