Fig. 1
Download original image
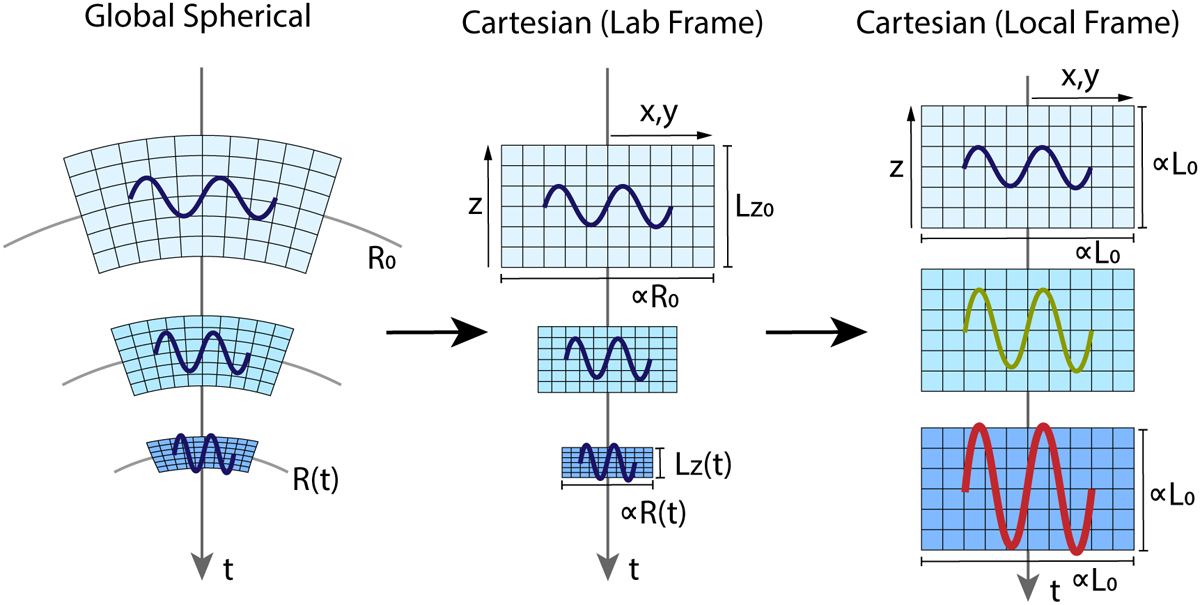
Cartoon illustration of the local collapsing box model. On the left, the global geometry depicts a domain moving radially due to background flow. The volume of the domain varies as it approaches the center of the spherical cloud, leading to changes in density. A compressing domain leads to a density increase, as is shown by the progressively darker blue color in the sequence. The horizontal domain size is proportional to ℛ(t), establishing the horizontal length scale in the local model (middle panel). The vertical length scale, Lz (t), is determined by the distance between the domain’s inner and outer radial boundaries, which is set by the background flow. Inside each box, a waveform signal illustrates how certain physical quantities evolve in the local model. The width of the waveform represents quantities that remains fixed in the local frame (e.g., wavelength). The amplitude of the waveform represents specific physical quantities that are expected to be constant in the global geometry throughout the collapse (e.g., angular momentum, isothermal physical sound speed). In the local reference frame (right), the corresponding quantities such as the shear flow velocity or the effective sound speed are amplified as the collapse proceeds and the length scale shrinks in the domain, while quantities such as the wavelength remain the same. This phenomenon is visually demonstrated by the vertically stretched waveforms in the sequence. For a more accurate and detailed understanding of this process, one should refer to the equations in Sec. 2.
Current usage metrics show cumulative count of Article Views (full-text article views including HTML views, PDF and ePub downloads, according to the available data) and Abstracts Views on Vision4Press platform.
Data correspond to usage on the plateform after 2015. The current usage metrics is available 48-96 hours after online publication and is updated daily on week days.
Initial download of the metrics may take a while.