Fig. 7
Download original image
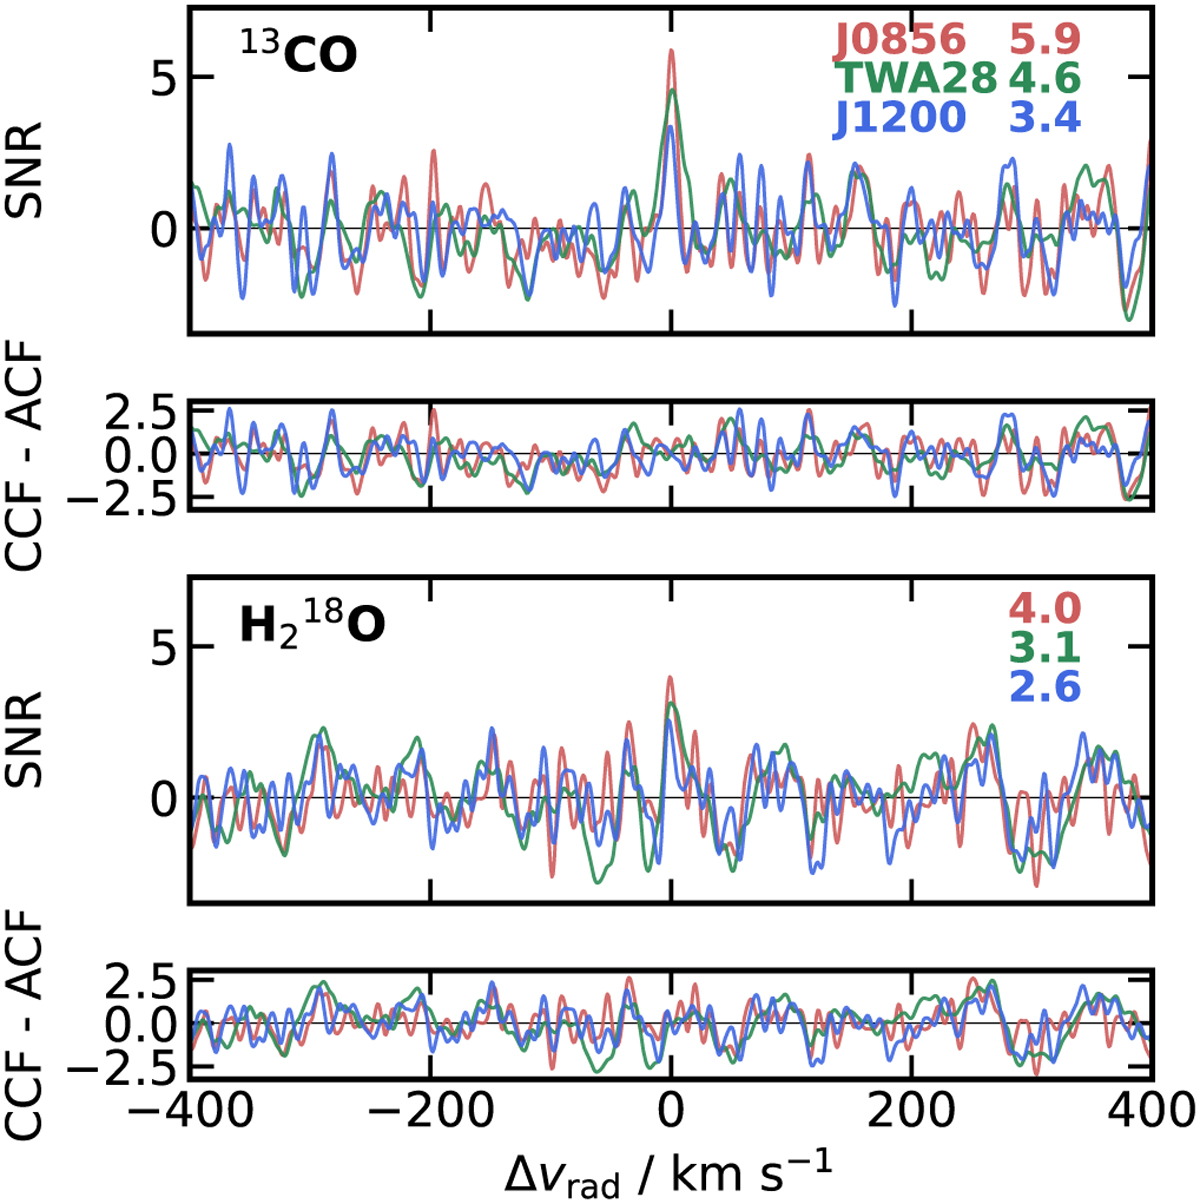
CCFs for 13CO and H218O. The CCFs are calculated for each order-detector pair and summed over all orders and detectors. The CCFs are converted to S/N by dividing them by the standard deviation of the CCFs away from the peak (|υrad| > 100 km s−1). The S/N of the peaks of the CCFs is shown in the legend. The residuals between the observed and modelled CCFs – the auto-correlation function (ACF) – are shown in the bottom panel.
Current usage metrics show cumulative count of Article Views (full-text article views including HTML views, PDF and ePub downloads, according to the available data) and Abstracts Views on Vision4Press platform.
Data correspond to usage on the plateform after 2015. The current usage metrics is available 48-96 hours after online publication and is updated daily on week days.
Initial download of the metrics may take a while.