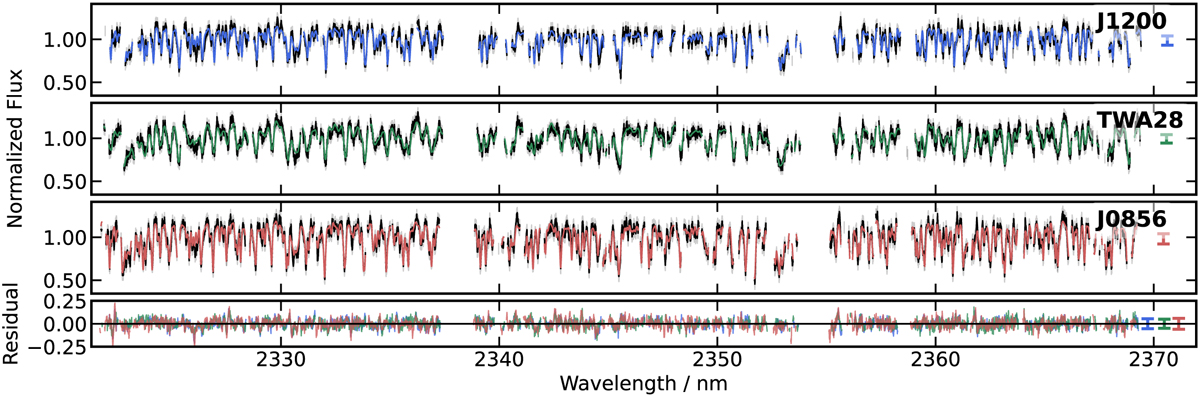
Fig. 4
Download original image
Best-fitting models retrieved for the three objects. The spectra correspond to the three detectors of a single order of CRIRES+. This wavelength range contains several 12CO and 13CO lines. The observed data are shown in black, and the corresponding best-fit models are in blue (J1200), green (TWA 28), and red (J0856). Residuals are shown in the bottom panel. The average scaled uncertainty is indicated on the right side of each panel. The data and the models are displayed in the rest frame of each object. The full wavelength coverage used in the retrievals is shown in Appendix D.
Current usage metrics show cumulative count of Article Views (full-text article views including HTML views, PDF and ePub downloads, according to the available data) and Abstracts Views on Vision4Press platform.
Data correspond to usage on the plateform after 2015. The current usage metrics is available 48-96 hours after online publication and is updated daily on week days.
Initial download of the metrics may take a while.