Open Access
Fig. A.1
Download original image
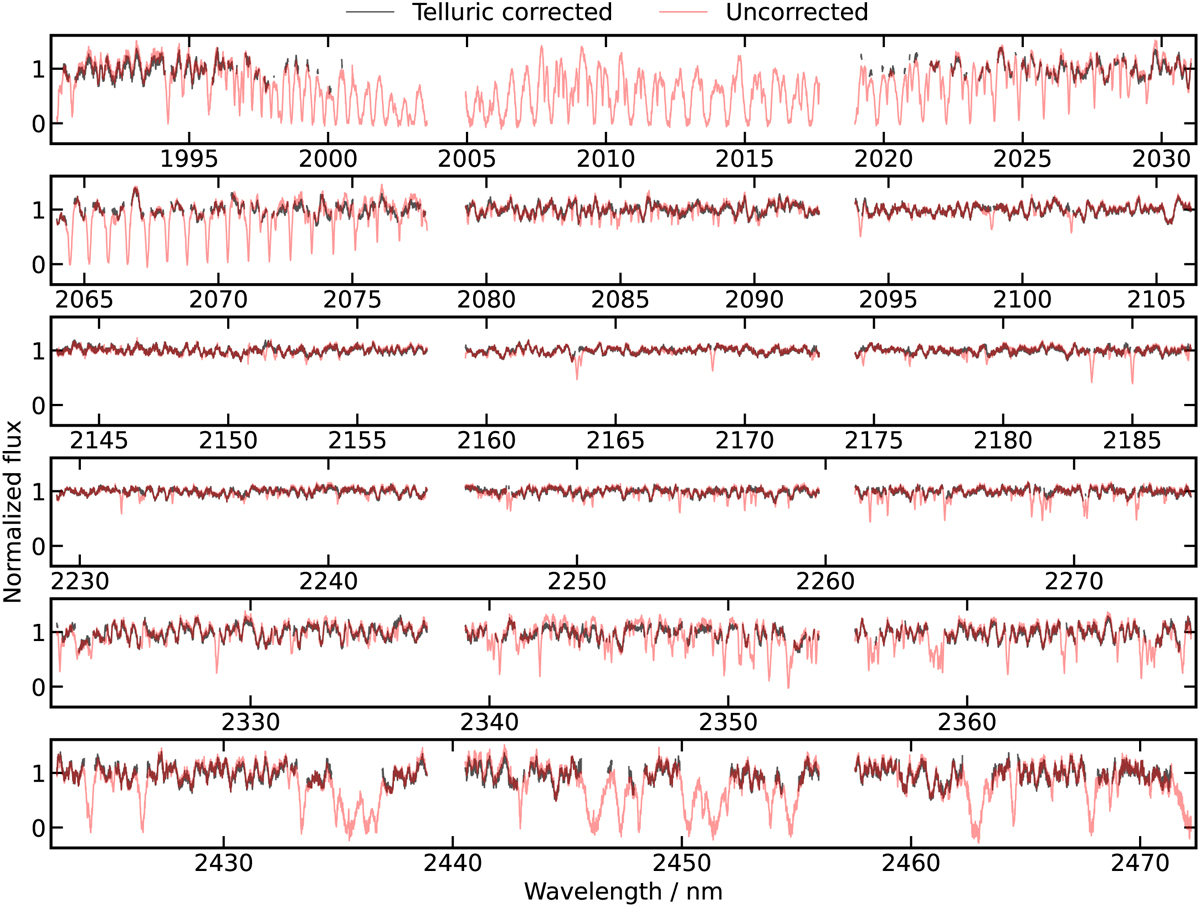
Telluric correction for TWA 28. Each panel shows a different spectral order. The corrected spectrum (black) is the result of dividing the data by the telluric model (red). Telluric lines deeper than 0.65 (continuum normalised to 1.0) with respect to the continuum are masked for the atmospheric retrieval.
Current usage metrics show cumulative count of Article Views (full-text article views including HTML views, PDF and ePub downloads, according to the available data) and Abstracts Views on Vision4Press platform.
Data correspond to usage on the plateform after 2015. The current usage metrics is available 48-96 hours after online publication and is updated daily on week days.
Initial download of the metrics may take a while.