Fig. 7.
Download original image
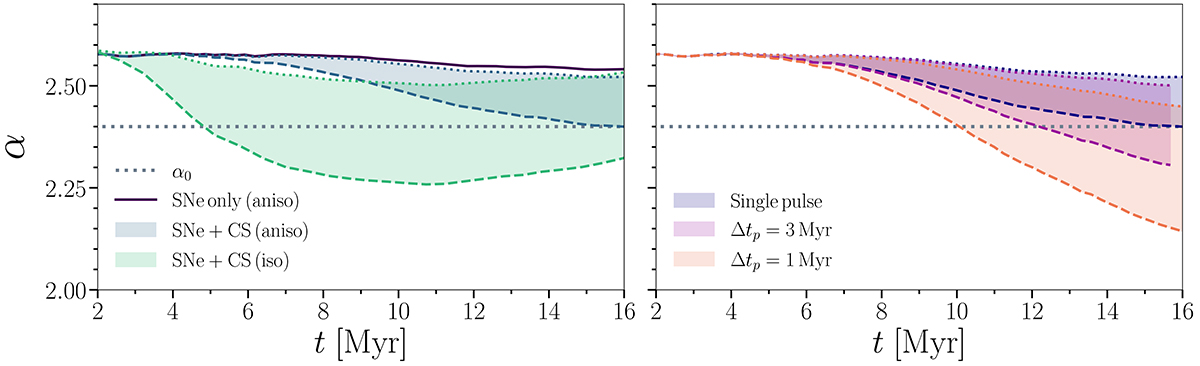
Evolution of the spectrum slope under various conditions. Because the exact quantity of energy injected at each pulse is only weakly constrained, this quantity is left as a free parameter, which can vary between 1056 and 1057 erg. The corresponding range of values obtained are represented by the colored surfaces, while the dotted (dashed) line represents the case where a total CR energy of 1056 erg (1057 erg) is injected from the CS at t = 0. The left panel shows the influence of the propagation mode (i.e. isotropic or anisotropic). The right panel shows the influence of the source intermittence. The results of our two simulations with intermittent source, i.e. with multiple injections separated in time by period Δt are presented for Δt = 1 Myr and Δt = 3 Myr. The simulation with single anisotropic injections is also represented by the solid line for comparison.
Current usage metrics show cumulative count of Article Views (full-text article views including HTML views, PDF and ePub downloads, according to the available data) and Abstracts Views on Vision4Press platform.
Data correspond to usage on the plateform after 2015. The current usage metrics is available 48-96 hours after online publication and is updated daily on week days.
Initial download of the metrics may take a while.