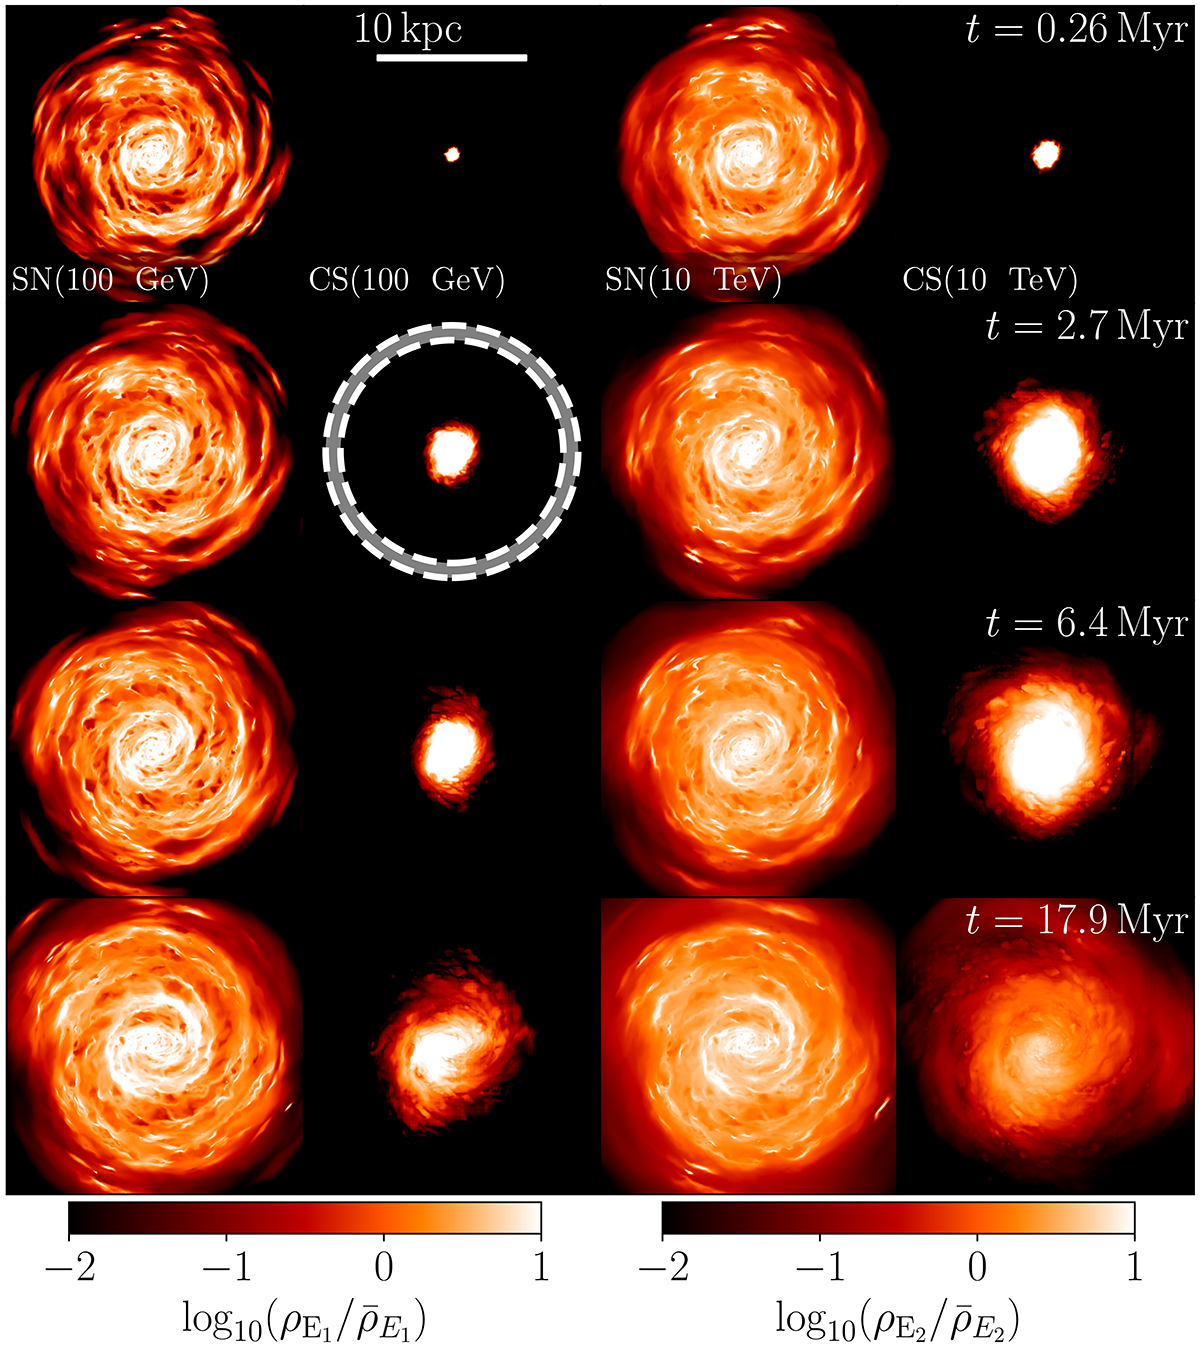
Fig. 2.
Download original image
Evolution of the several CR groups at four different times after injection of a pulse from the CS. The first and third columns present the energy density maps of the CR groups from SNe, at 100 GeV and 10 TeV respectively, while the second and fourth rows presents the same quantity for the CR groups associated with the CS. Each maps are normalized by the mean energy density in the SNe group at t = 0. The gray annulus in the second column represents the solar neighborhood as defined in the main text. (Movie available online).
Current usage metrics show cumulative count of Article Views (full-text article views including HTML views, PDF and ePub downloads, according to the available data) and Abstracts Views on Vision4Press platform.
Data correspond to usage on the plateform after 2015. The current usage metrics is available 48-96 hours after online publication and is updated daily on week days.
Initial download of the metrics may take a while.