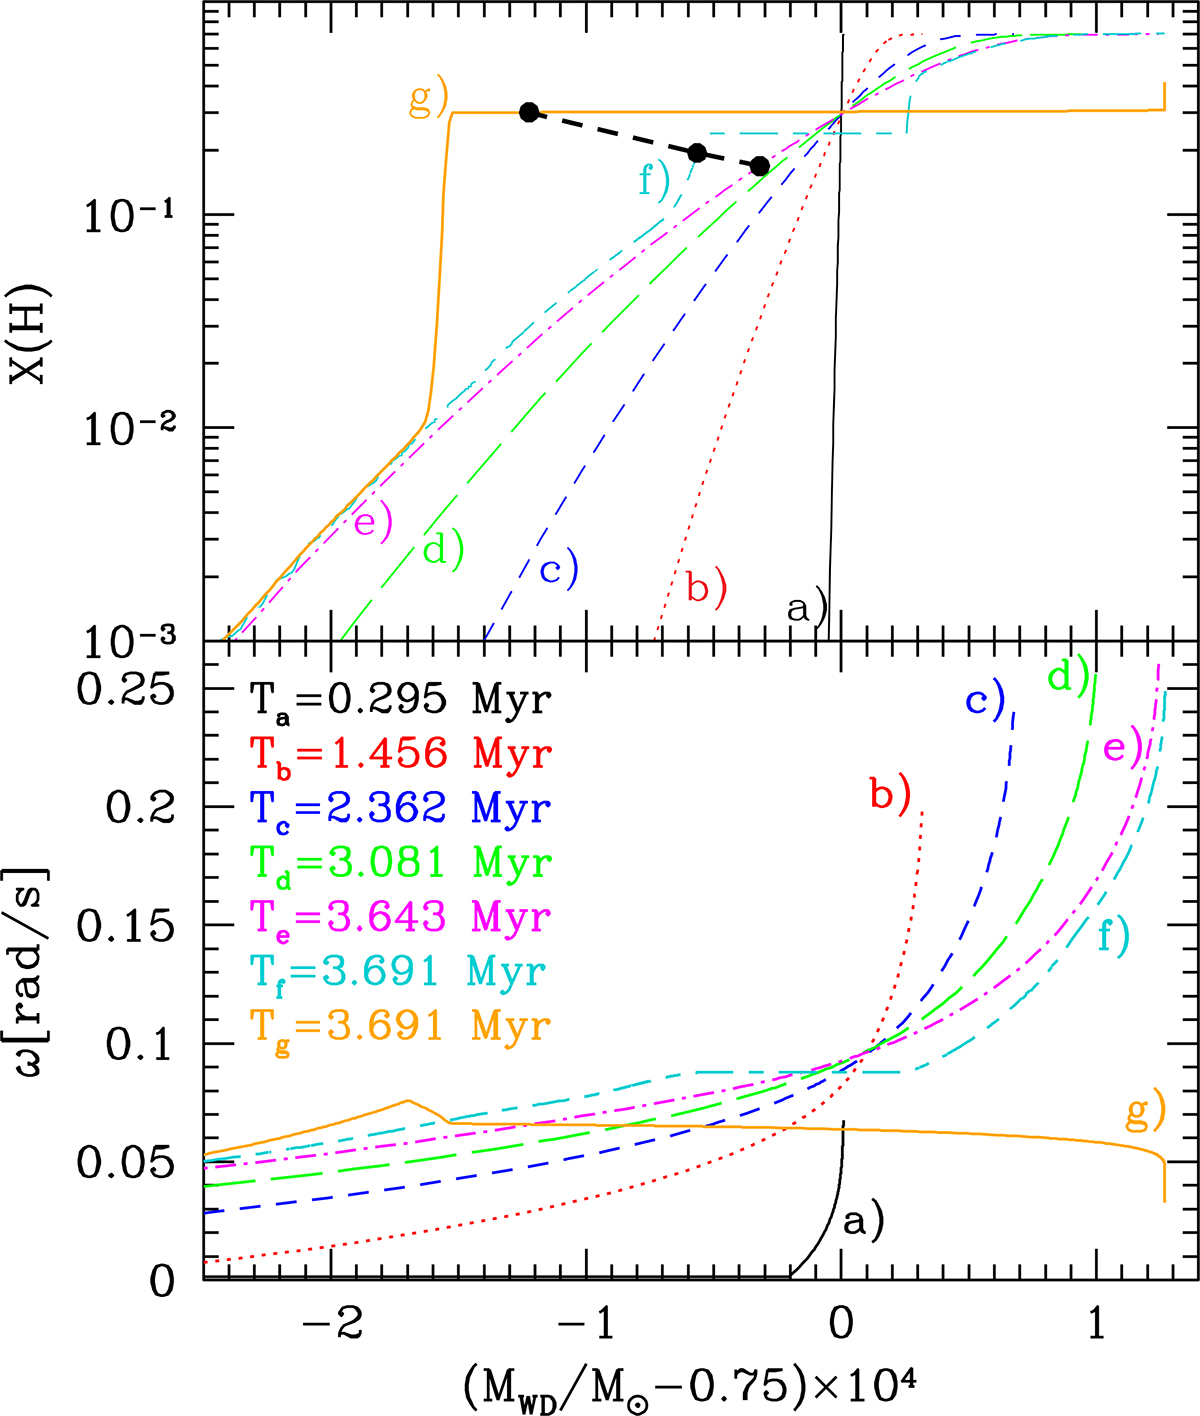
Fig. 5.
Download original image
Profiles of hydrogen abundance X(H) (upper panel) and angular velocity (lower panel) at various epochs during the first mass-transfer episode in the rotating model. The time after the onset of mass transfer corresponding to each line is reported in the plot. The x-axis is defined in such a way that the original WD surface (M = 0.75 M⊙) coincides with the origin. Lines a to e correspond to the evolution before the onset of the H-flash; line f corresponds to the epoch when flash-driven convection sets in; line g corresponds to the epoch when flash-driven convection attains its maximum extension. Dots connected by the heavy dashed line mark the position of the H-burning shell.
Current usage metrics show cumulative count of Article Views (full-text article views including HTML views, PDF and ePub downloads, according to the available data) and Abstracts Views on Vision4Press platform.
Data correspond to usage on the plateform after 2015. The current usage metrics is available 48-96 hours after online publication and is updated daily on week days.
Initial download of the metrics may take a while.