Fig. 9
Download original image
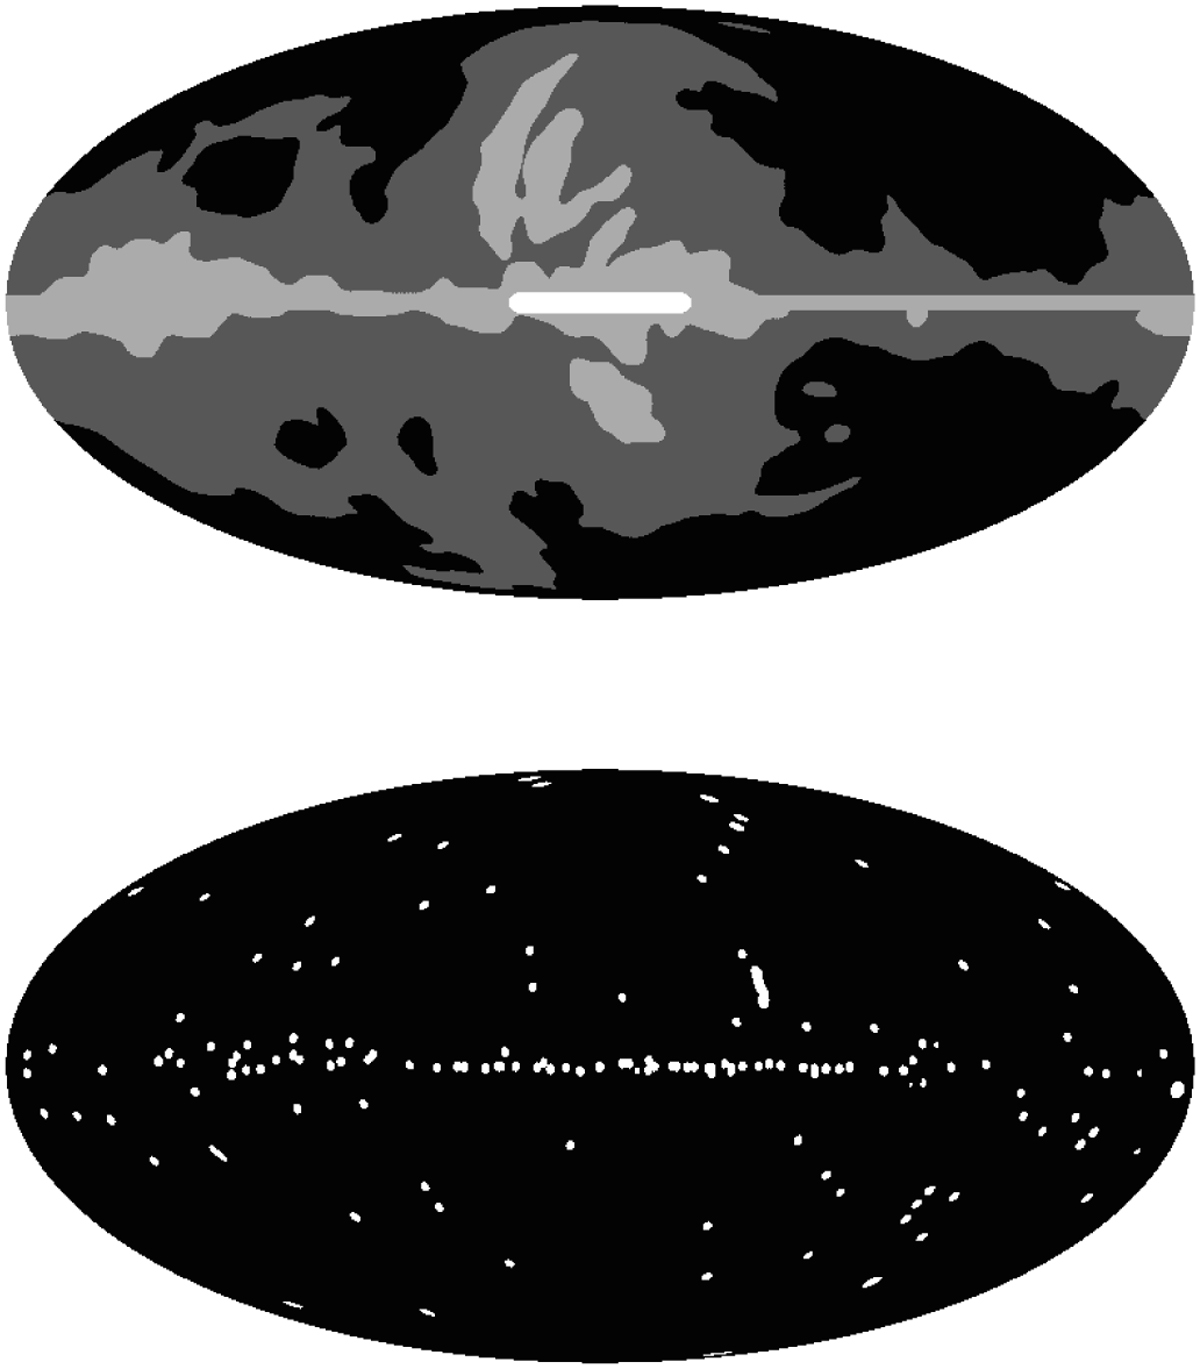
Masks used to compute power spectra shown in Fig. 12. In the top panel, the low, medium, and high-amplitude regions of emission are shown in black, dark gray, and light gray, respectively. The white region, located in the inner Galactic ridge, corresponds to the strongest region of polarized synchrotron emission, and is excluded for all power spectra computations. The bottom panel shows a mask for compact sources.
Current usage metrics show cumulative count of Article Views (full-text article views including HTML views, PDF and ePub downloads, according to the available data) and Abstracts Views on Vision4Press platform.
Data correspond to usage on the plateform after 2015. The current usage metrics is available 48-96 hours after online publication and is updated daily on week days.
Initial download of the metrics may take a while.