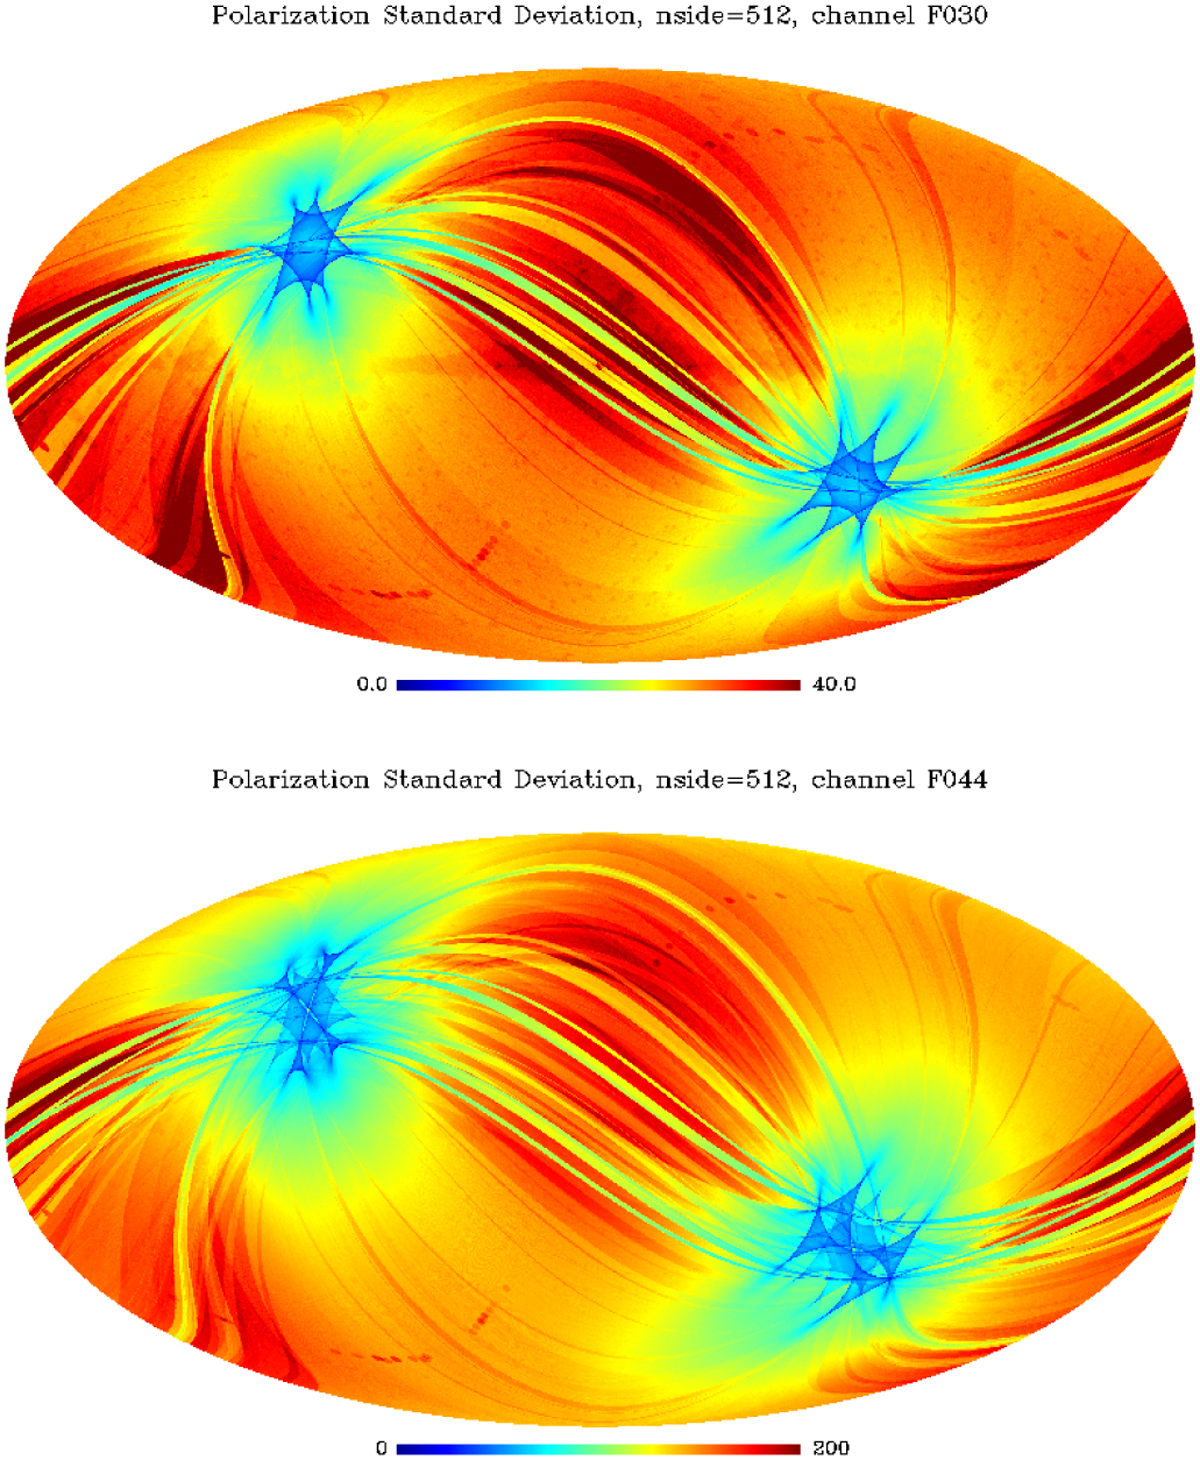
Fig. 2
Download original image
Noise standard deviation maps for the two Planck LFI channels used in this work (30 and 44 GHz), rescaled to equivalent 30 GHz noise assuming a synchrotron spectral index of −3.1. Units are in μKcmb. Each map displays the average of the standard deviation of the Q and U Stokes parameter maps. Here and in Fig. 1, different color scales have been used for the different frequency channels. We note that the noise level for each channel is variable across the sky, and that the shape and location of the lowest-noise regions is channel-dependent. The map depth varies by an order of magnitude across the sky, and the lowest-noise regions are different between the maps. This calls for pixel-dependent weights for map combination.
Current usage metrics show cumulative count of Article Views (full-text article views including HTML views, PDF and ePub downloads, according to the available data) and Abstracts Views on Vision4Press platform.
Data correspond to usage on the plateform after 2015. The current usage metrics is available 48-96 hours after online publication and is updated daily on week days.
Initial download of the metrics may take a while.