Fig. 12
Download original image
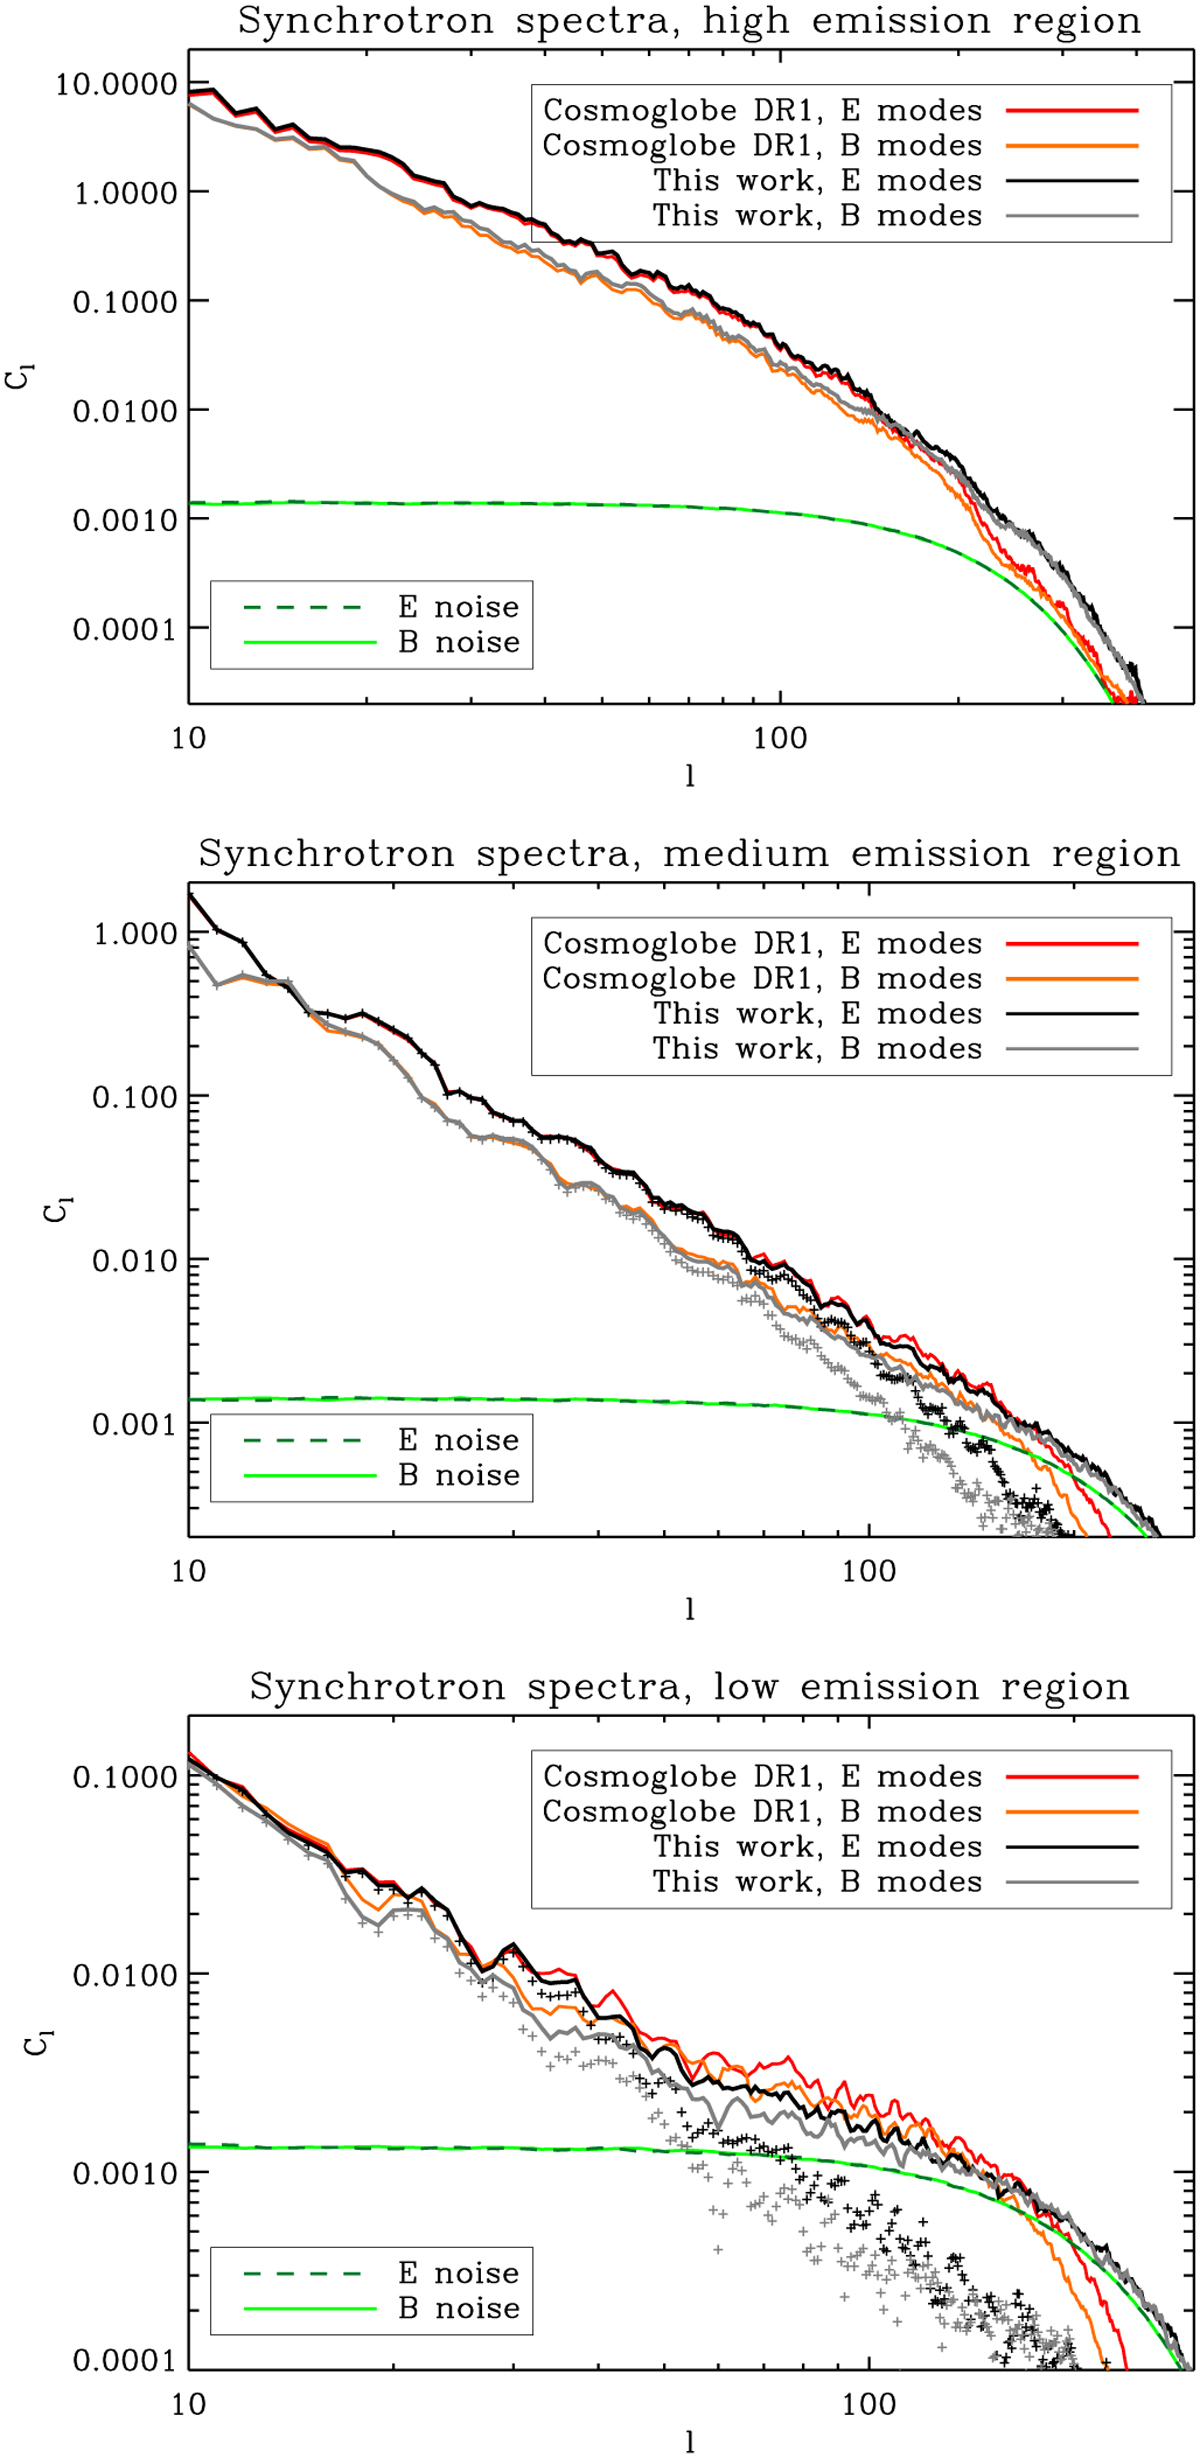
Power spectra of polarized synchrotron emission in three different sky regions, selected using the masks outlined in Fig. 9. The data was plotted after smoothing the spectra with a Δℓ = 3 window. In the high- and medium-emission regions (top and middle panels), spectra are strongly signal-dominated. There is excellent agreement between our maps and the Cosmoglobe DR1 maps up to ℓ ≃ 30, above which the Cosmoglobe spectra are somewhat lower. At scales where signal dominates over noise, this discrepancy, increasing with increasing ℓ, must be due to different effective beams. In the low-emission region (bottom panel), of specific interest for future ground-based observations of CMB B-modes, the Cosmoglobe polarization maps have significantly higher power for 50 < ℓ < 100 than our maps. This is indicative of higher noise contamination, while the lower power of the Cosmoglobe maps at higher ℓ likely indicates a larger effective beam. For the medium- and low-contamination regions, we show the noise-debiased power spectra of our synchrotron polarization maps with “+” data points. Noise spectra were computed from 200 simulations of WMAP and Planck LFI noise, propagated through the analysis pipeline.
Current usage metrics show cumulative count of Article Views (full-text article views including HTML views, PDF and ePub downloads, according to the available data) and Abstracts Views on Vision4Press platform.
Data correspond to usage on the plateform after 2015. The current usage metrics is available 48-96 hours after online publication and is updated daily on week days.
Initial download of the metrics may take a while.