Open Access
Fig. 10
Download original image
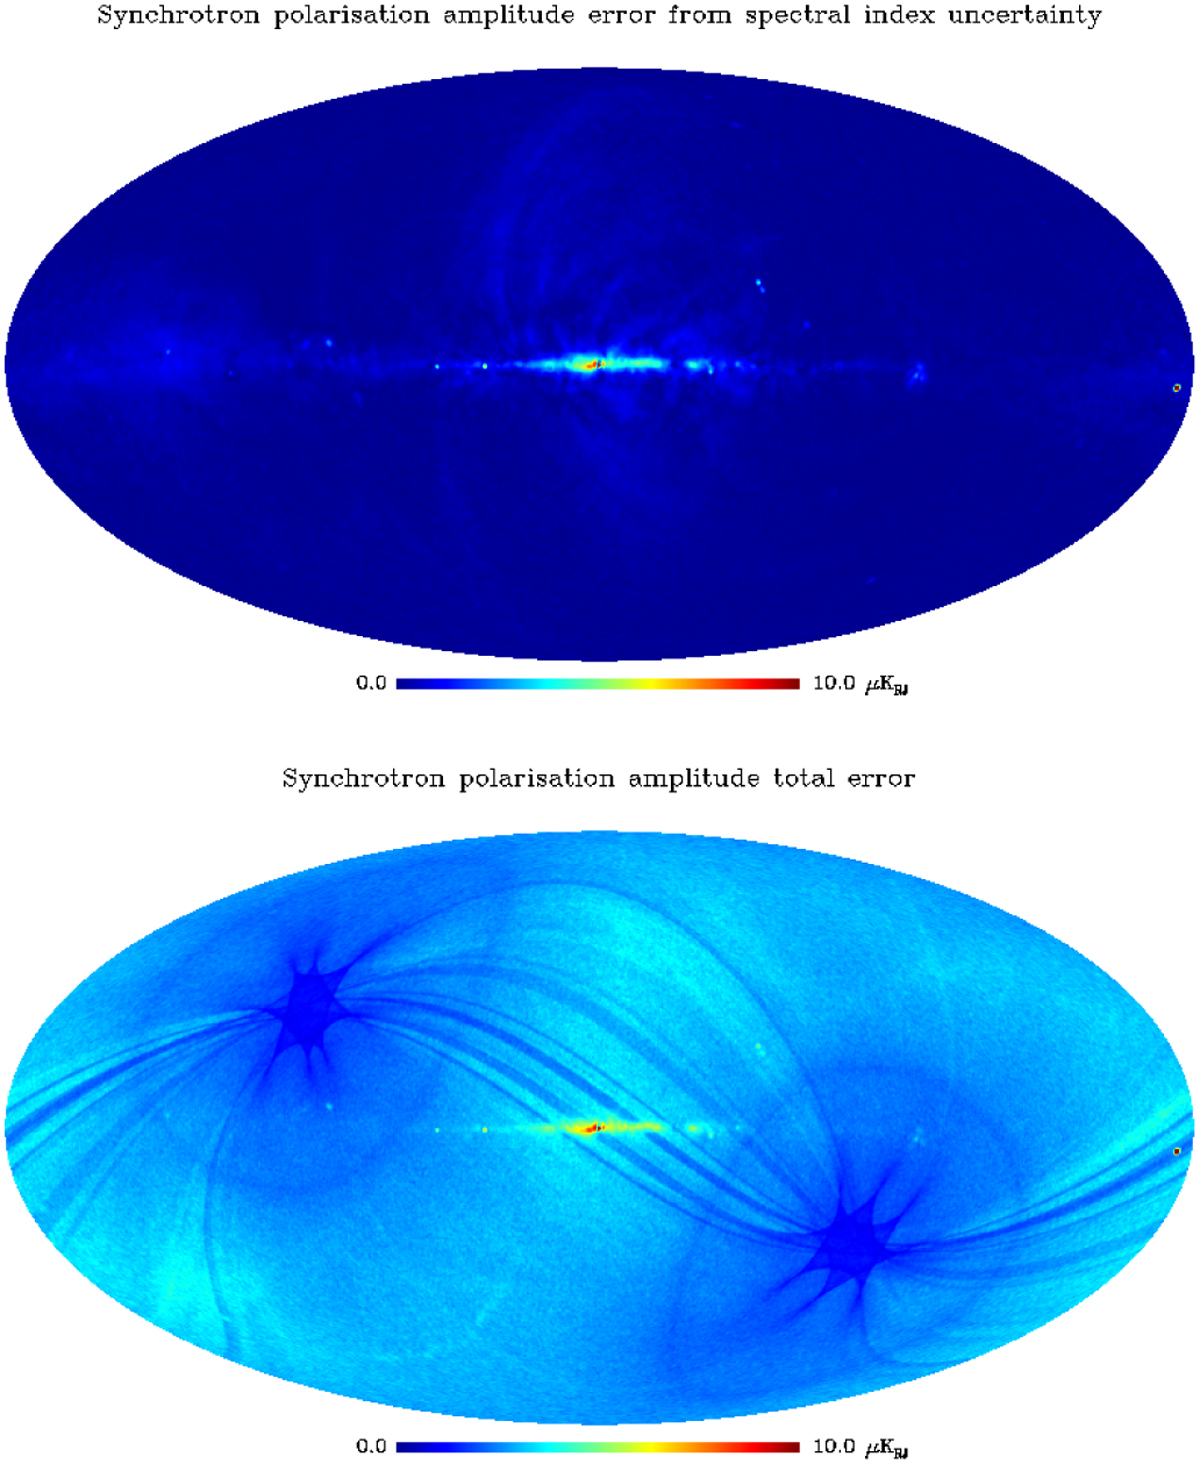
Impact of spectral index uncertainty on the polarized intensity maps. Top: standard deviation of 50 maps obtained with βs drawn at random with a Gaussian distribution centered on βs = −3.1 and with a standard deviation of 0.1. Bottom: sum in quadrature of the above error and of the noise standard deviation.
Current usage metrics show cumulative count of Article Views (full-text article views including HTML views, PDF and ePub downloads, according to the available data) and Abstracts Views on Vision4Press platform.
Data correspond to usage on the plateform after 2015. The current usage metrics is available 48-96 hours after online publication and is updated daily on week days.
Initial download of the metrics may take a while.