Fig. 6.
Download original image
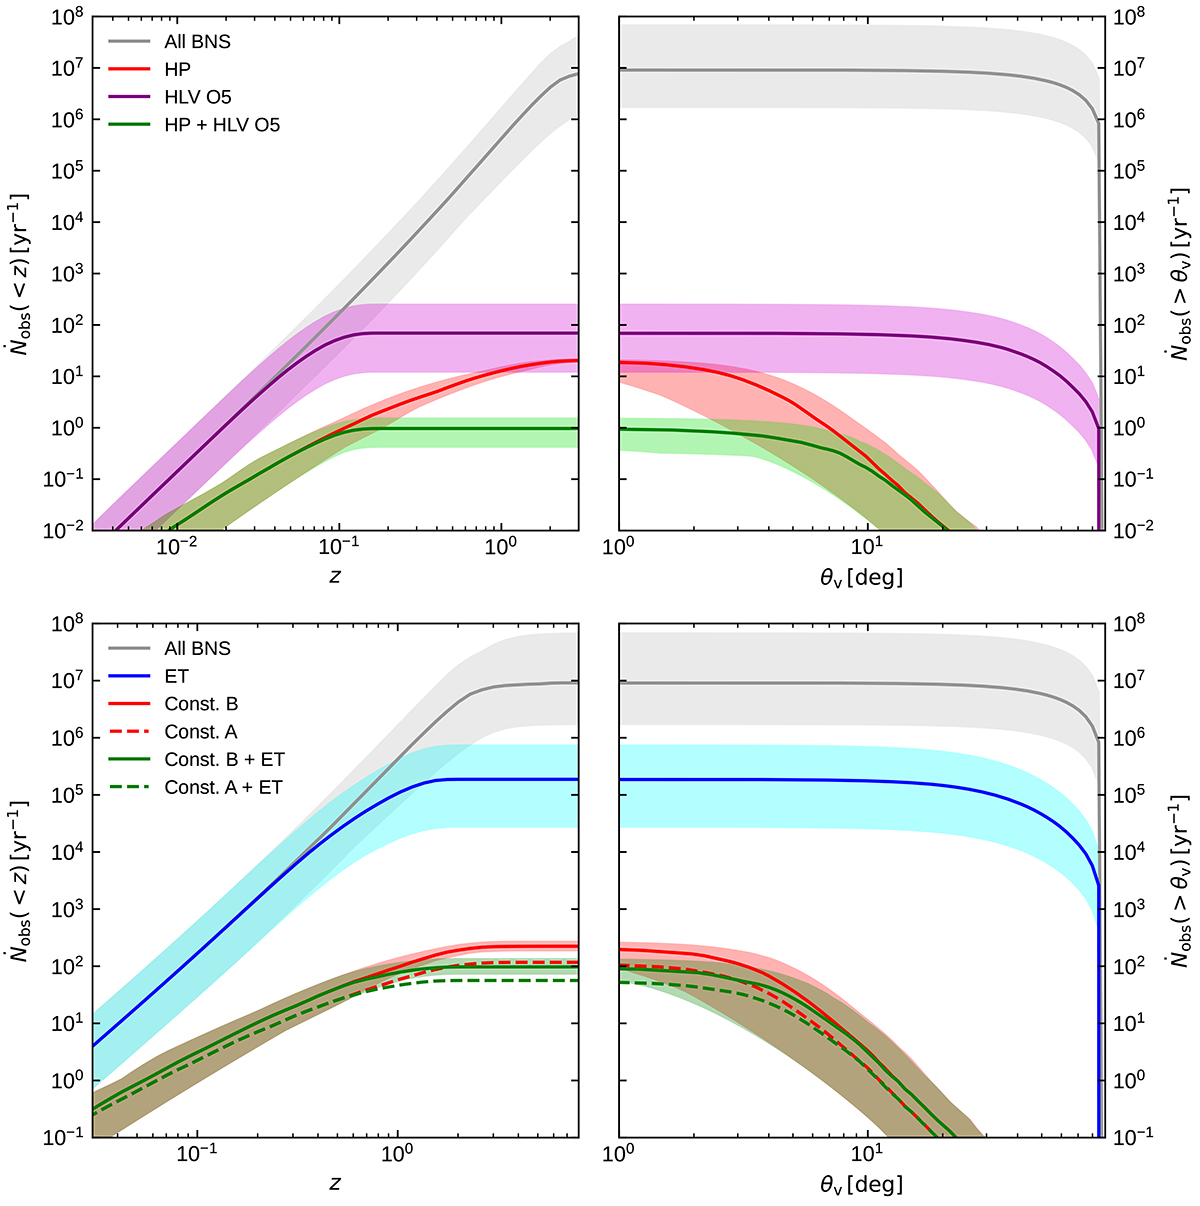
Top-left panel: Cumulative detection rates as a function of redshift at the time of the O5 GW detector network run. Different colors refer to subpopulations that satisfy different detection cut combinations (gray: all events; purple: detection by the HLV GW network with O5 sensitivity; red: detection by HERMES Pathfinder; green: joint detection by HERMES and the HLV network). For each subpopulation, the solid line shows the median cumulative rate, while the shaded band encompasses the 90% credible range at fixed z. Top-right panel: Inverse-cumulative rates of events with a viewing angle larger than a given threshold. The meaning of the colors, lines, and bands is the same as in the top-left panel. Bottom-left panel: Similar to the top-left panel, but for HERMES constellations A and B, together with the ET GW detector at design sensitivity (ET-D). Light blue refers to the ET cumulative detection rate; the red solid line and shaded region show the detection rate (median and 90% uncertainty) by the HERMES Constellation B, while the red dashed line shows the median for Constellation A. The green solid line and green shaded region refer to events detected by both ET and HERMES Constellation B. The dashed line shows the median detection rate for ET and HERMES Constellation A. Bottom-right panel: Similar to the top-right panel, but for ET and HERMES Constellations A and B.
Current usage metrics show cumulative count of Article Views (full-text article views including HTML views, PDF and ePub downloads, according to the available data) and Abstracts Views on Vision4Press platform.
Data correspond to usage on the plateform after 2015. The current usage metrics is available 48-96 hours after online publication and is updated daily on week days.
Initial download of the metrics may take a while.