Fig. 4.
Download original image
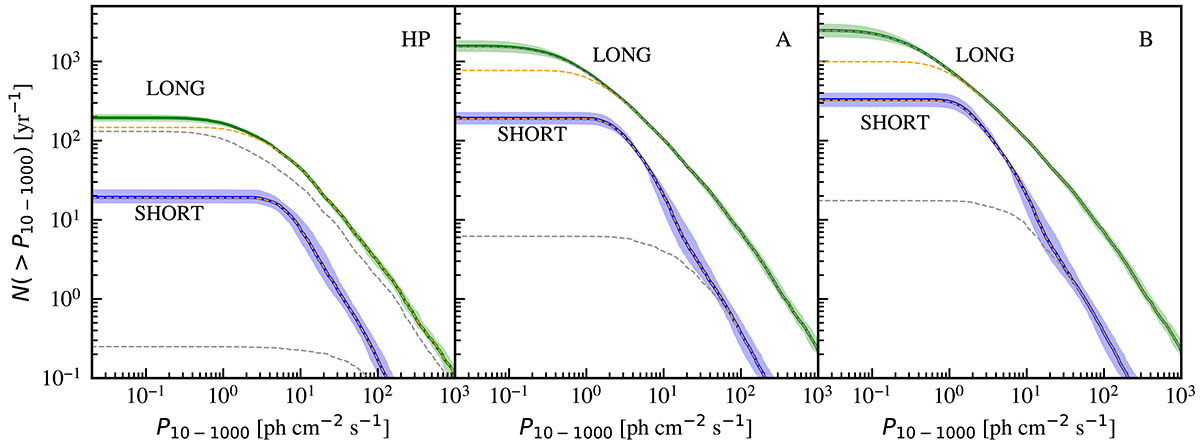
Cumulative distributions of the photon peak flux (in the energy range 10–1000 keV) for the GRBs detected by HERMES HP (left panel), Constellation A (center), and Constellation B (right). In each panel, the cumulative curve for long (short) GRBs is shown in green (blue), and the shaded region includes 68% of the realisations. Orange (gray) dashed curves show the contribution of the S (X) detection mode. For Constellations A and B, almost all long GRBs are detected by the X mode, making the dashed gray curve almost overlap with the total distribution (solid green curve).
Current usage metrics show cumulative count of Article Views (full-text article views including HTML views, PDF and ePub downloads, according to the available data) and Abstracts Views on Vision4Press platform.
Data correspond to usage on the plateform after 2015. The current usage metrics is available 48-96 hours after online publication and is updated daily on week days.
Initial download of the metrics may take a while.