Fig. 6
Download original image
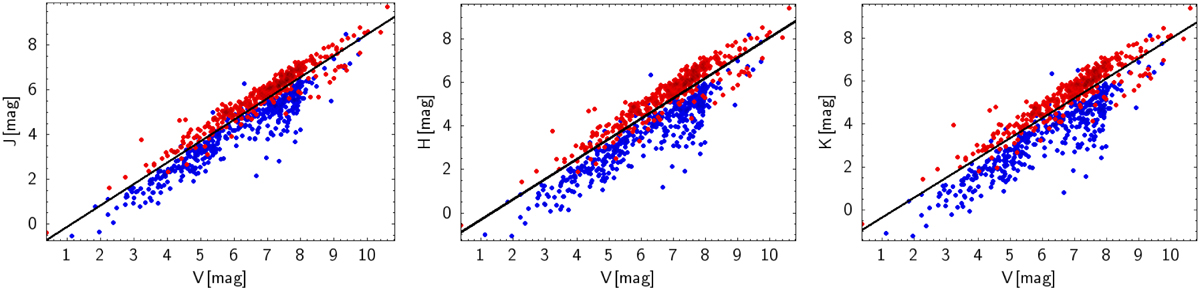
Panels representing the J, H, and K magnitudes versus the V magnitude for the sample of 437 giants and 637 dwarfs described in Sect. 5.2, with the linear separation found by Bilir et al. (2006b) in each respective diagram. The dwarf and giant stars are represented by red and blue dots, respectively.
Current usage metrics show cumulative count of Article Views (full-text article views including HTML views, PDF and ePub downloads, according to the available data) and Abstracts Views on Vision4Press platform.
Data correspond to usage on the plateform after 2015. The current usage metrics is available 48-96 hours after online publication and is updated daily on week days.
Initial download of the metrics may take a while.