Fig. 4
Download original image
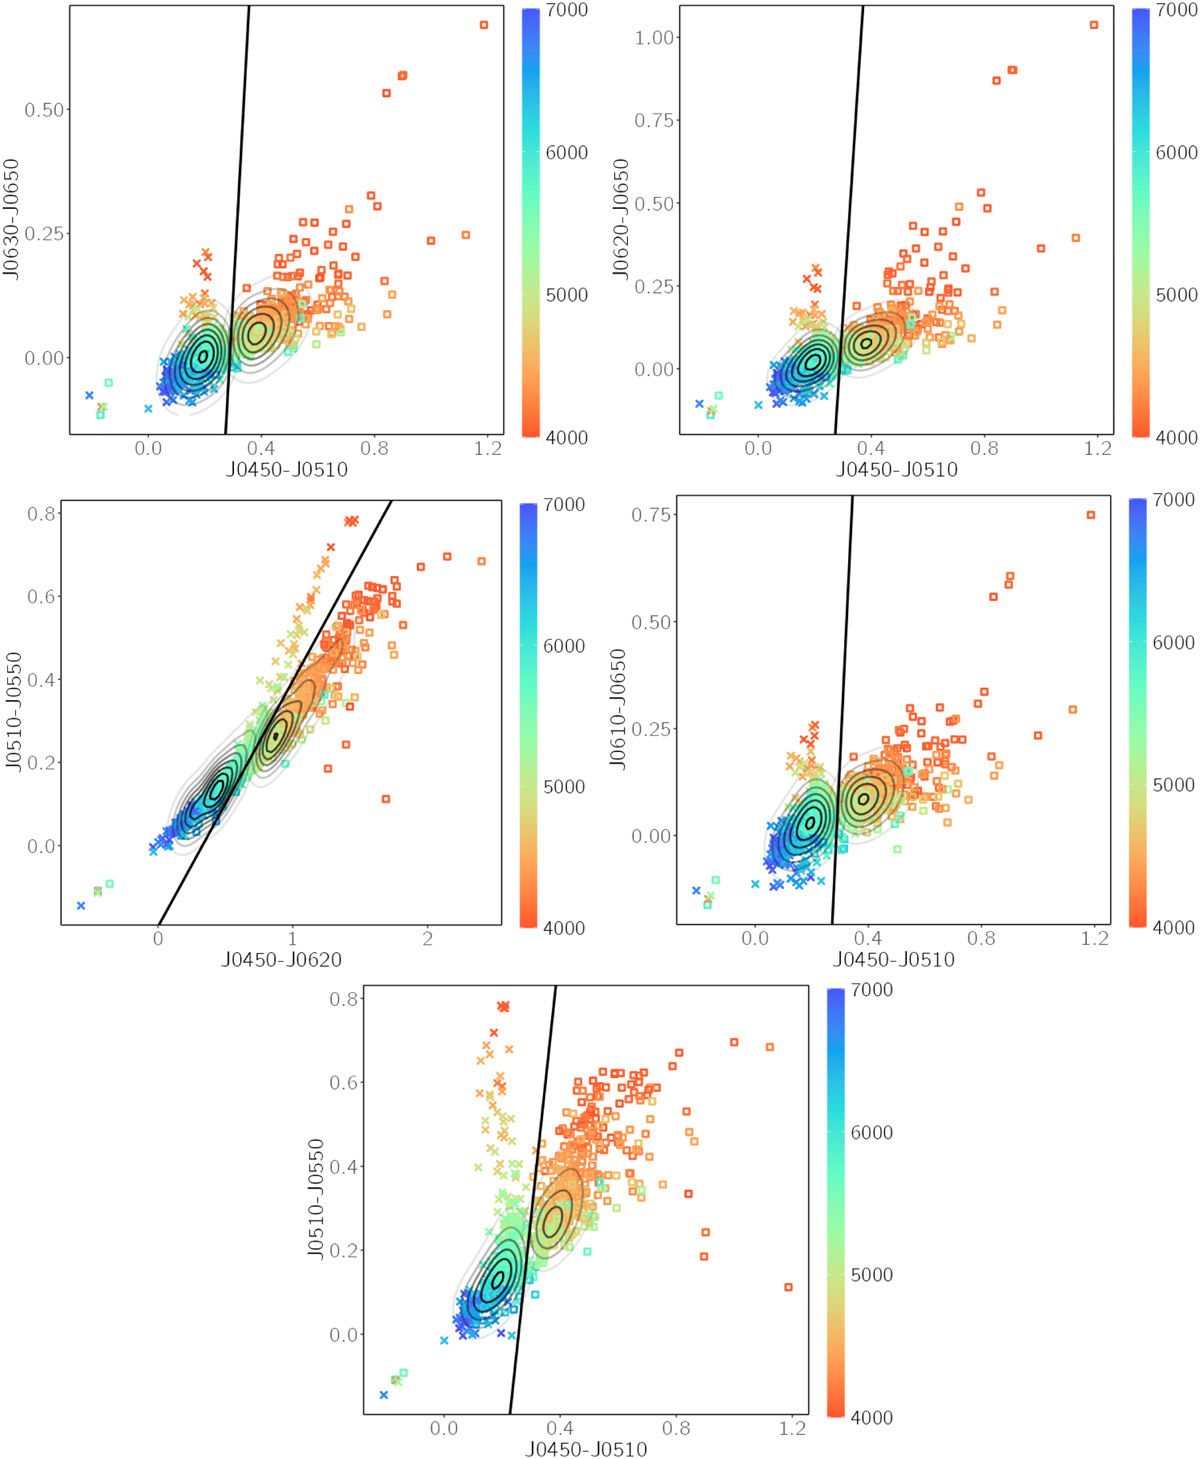
Colour-colour diagrams from J-PAS filters obtained with the GMM method, based on RI values, colour ranges, and expected colour errors. The dwarf stars from spectral libraries – MILES, STELIB, and ELODIE – are represented by crosses and giant stars by squares, both colour-coded according to their Teff values. The grey curves represent probability density contours across a 2D density plot. The darker the curve is, the higher the density is. The solid lines show the best separation between the two groups according to the SVM solution (see text).
Current usage metrics show cumulative count of Article Views (full-text article views including HTML views, PDF and ePub downloads, according to the available data) and Abstracts Views on Vision4Press platform.
Data correspond to usage on the plateform after 2015. The current usage metrics is available 48-96 hours after online publication and is updated daily on week days.
Initial download of the metrics may take a while.